LLM Training Dashboard
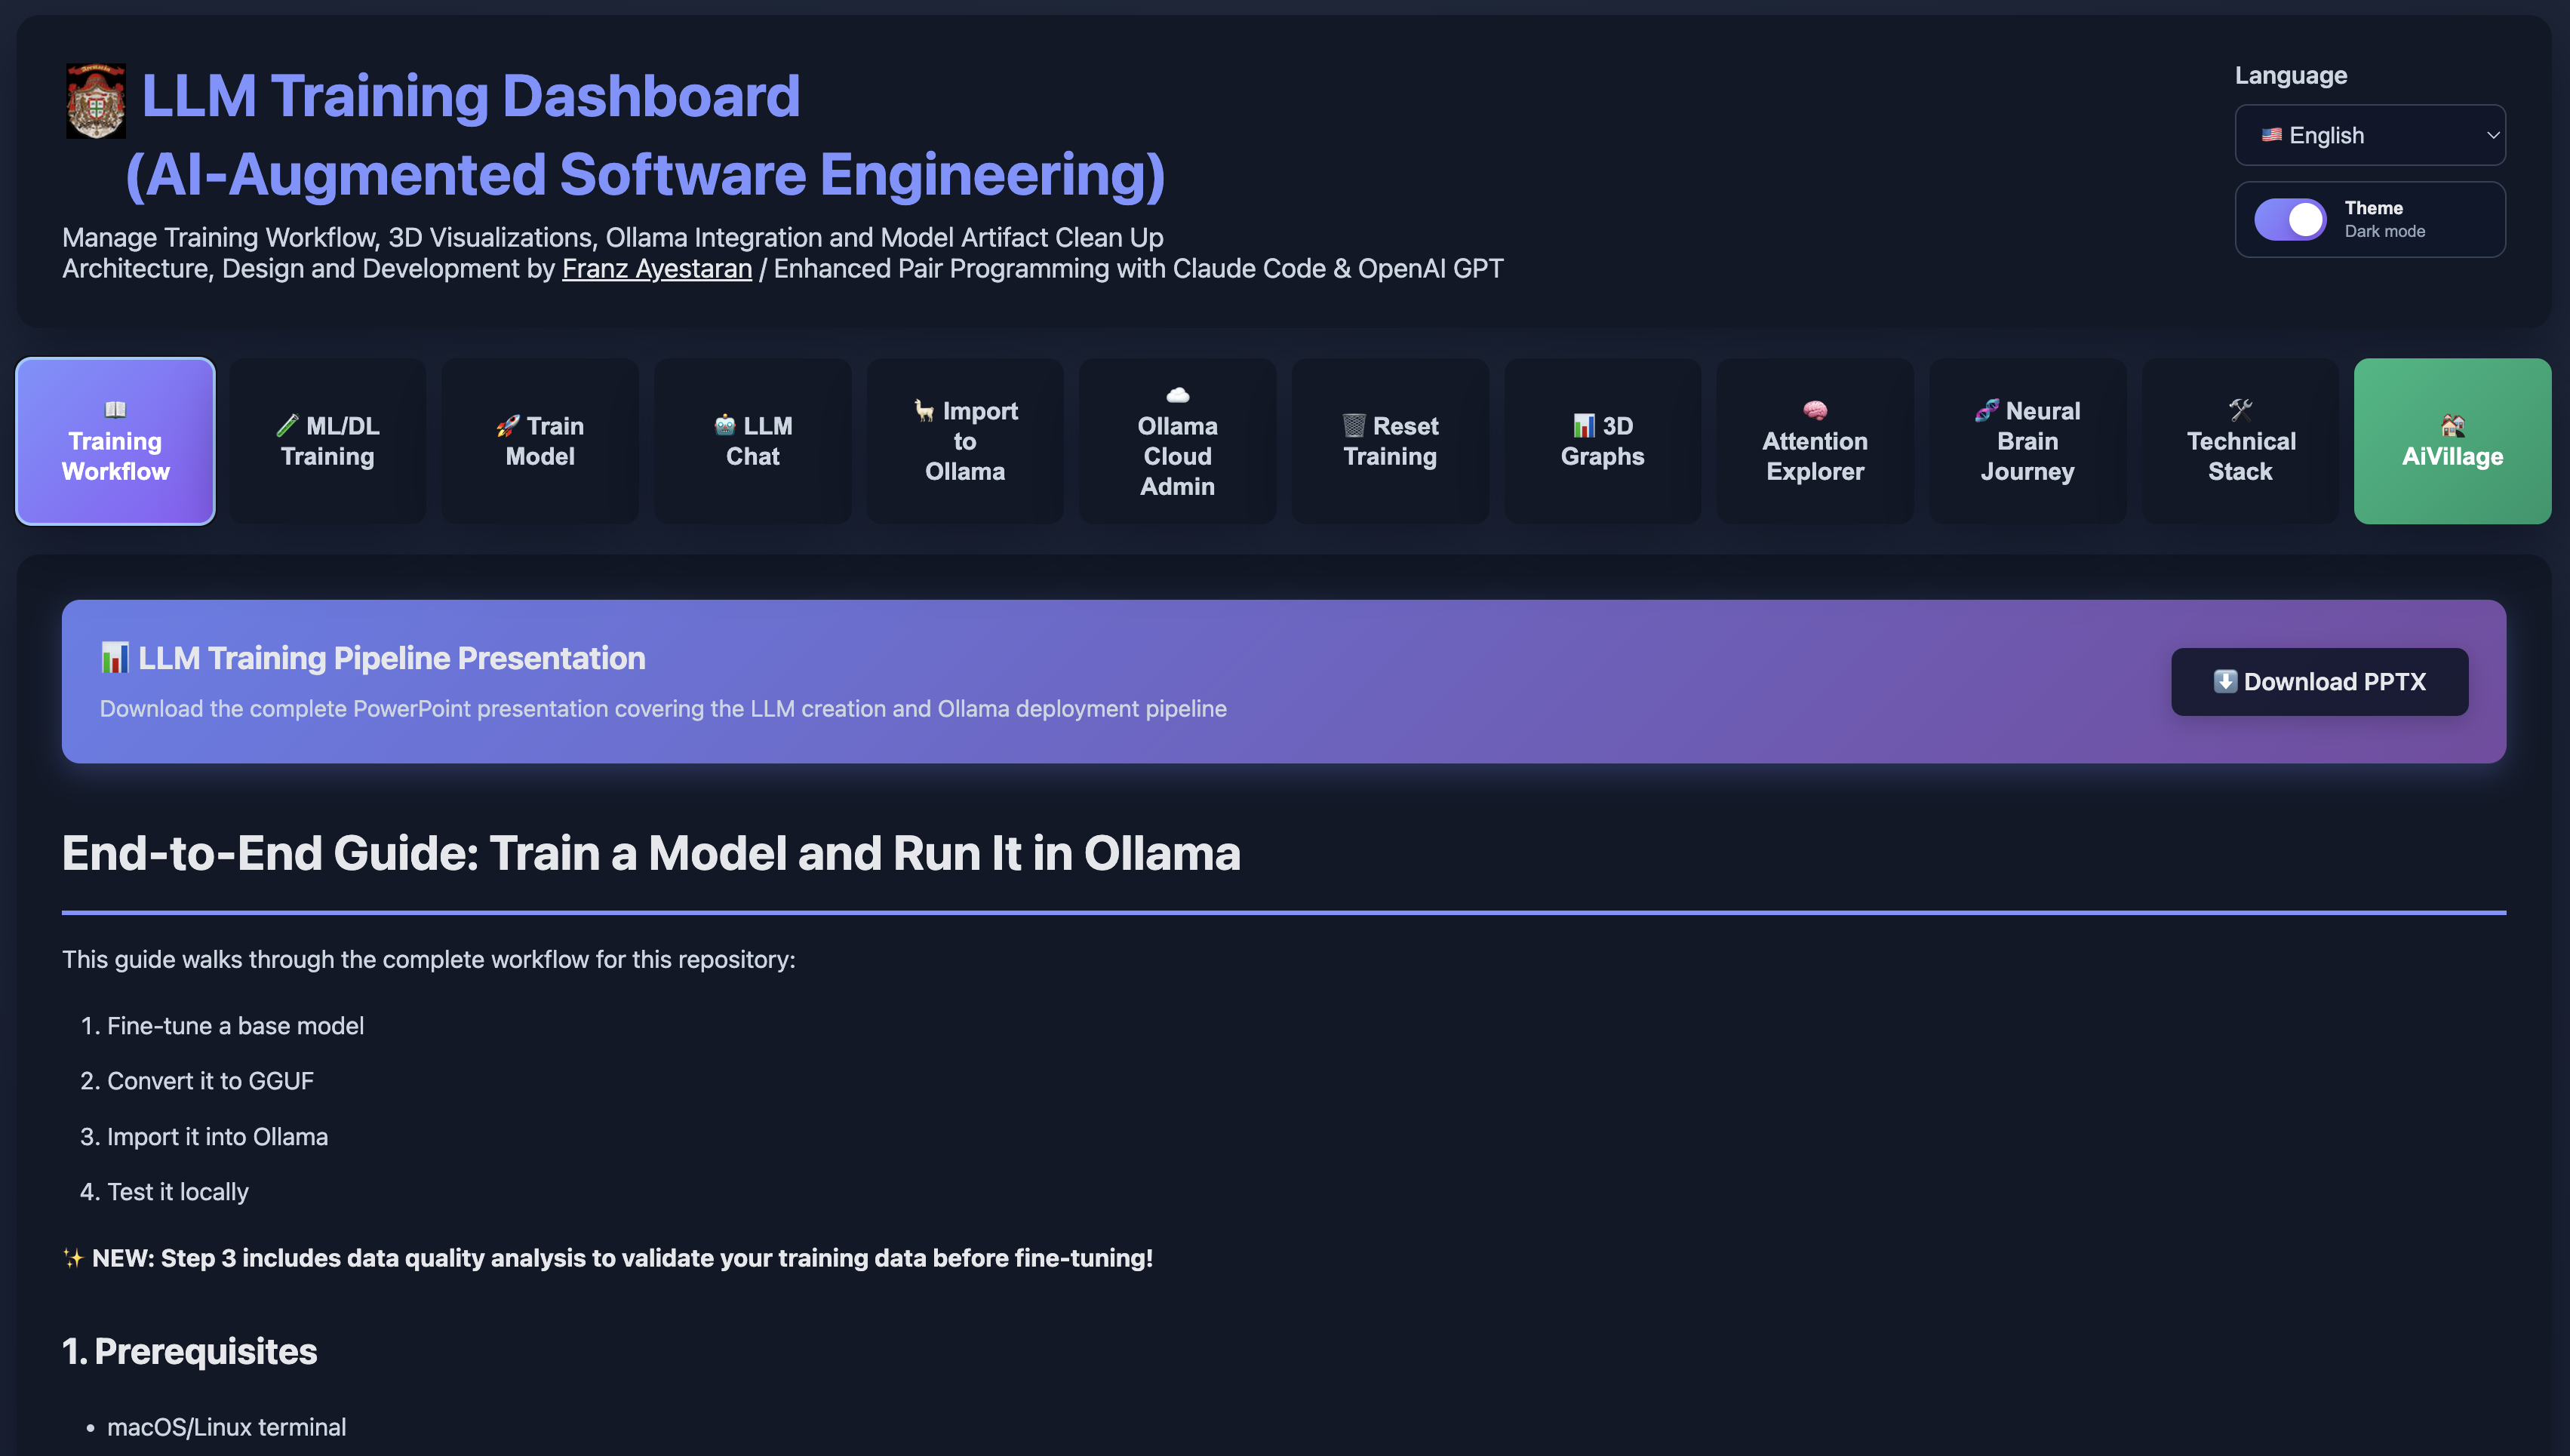
Open Web AppThe LLM Training Dashboard is a fully integrated, AI‑augmented software‑engineering environment designed to make the inner workings of modern language models visible, explorable, and understandable, powering AI across industries with 3 Training Modes: Molecular AI, Scientific Graph & LLM Training — bridging symbolic reasoning and scientific discovery. At its foundation is the 12‑Level Transformer Interpretability Stack — a structured, multi‑layer analytical framework that reveals how models embed information, route attention, form concepts, and evolve reasoning across training. This stack is woven throughout the dashboard’s visual modules, telemetry systems, and training workflows, turning the traditionally opaque behaviour of transformers into something observable and intuitive. The dashboard transforms the entire lifecycle of LLM development — dataset preparation, training configuration, fine‑tuning execution, model conversion, deployment to Ollama, and interactive inference — into a guided, interactive, and highly visual workflow. Instead of requiring users to navigate complex command‑line tools or deep ML frameworks, the dashboard abstracts these processes into intuitive controls and dynamic visualisations that expose what the model is doing internally. Specialised modules such as 3D Graphs, Attention Explorer, and Neural Brain Journey map directly onto the interpretability stack, each illuminating different layers of transformer behaviour. Users can inspect attention patterns, token relationships, embedding structures, activation flows, and reasoning dynamics — gaining insight into how the model interprets input, distributes focus, and evolves during training. These tools make it possible to understand not just the outputs of the model, but the mechanisms that produce them. The dashboard integrates deeply with the Ollama ecosystem, providing one‑click workflows for converting fine‑tuned Hugging Face models into GGUF format, importing them into Ollama, and testing them locally. This end‑to‑end pipeline allows users to go from raw text data to a fully deployable local LLM without leaving the dashboard environment. Data‑quality analysis tools evaluate token counts, vocabulary coverage, sequence distribution, and training feasibility — ensuring that users understand the strengths and limitations of their datasets before fine‑tuning. Detailed telemetry and execution traces reveal how training behaves across epochs, how attention shifts, how concepts form, and how reasoning stabilises — all aligned with the interpretability stack. Beyond training and deployment, the dashboard serves as a research and educational platform. It provides structured guidance, transparent execution traces, and experiment‑comparison tools that help students, engineers, and researchers explore how LLMs behave under different conditions. The interface supports iterative experimentation, allowing users to adjust hyperparameters, compare runs, inspect model artefacts, and refine their training strategies with immediate feedback. As part of the broader LLMTraining.dev ecosystem, the dashboard acts as the central hub for model creation, experimentation, and deployment — bridging the gap between theoretical understanding and hands‑on engineering. It demonstrates the design and implementation of a complete LLM training and interpretability environment, revealing how models think, learn, and make decisions — and empowering users to shape those behaviours through guided, transparent workflows.
Machine & Deep Learning Console
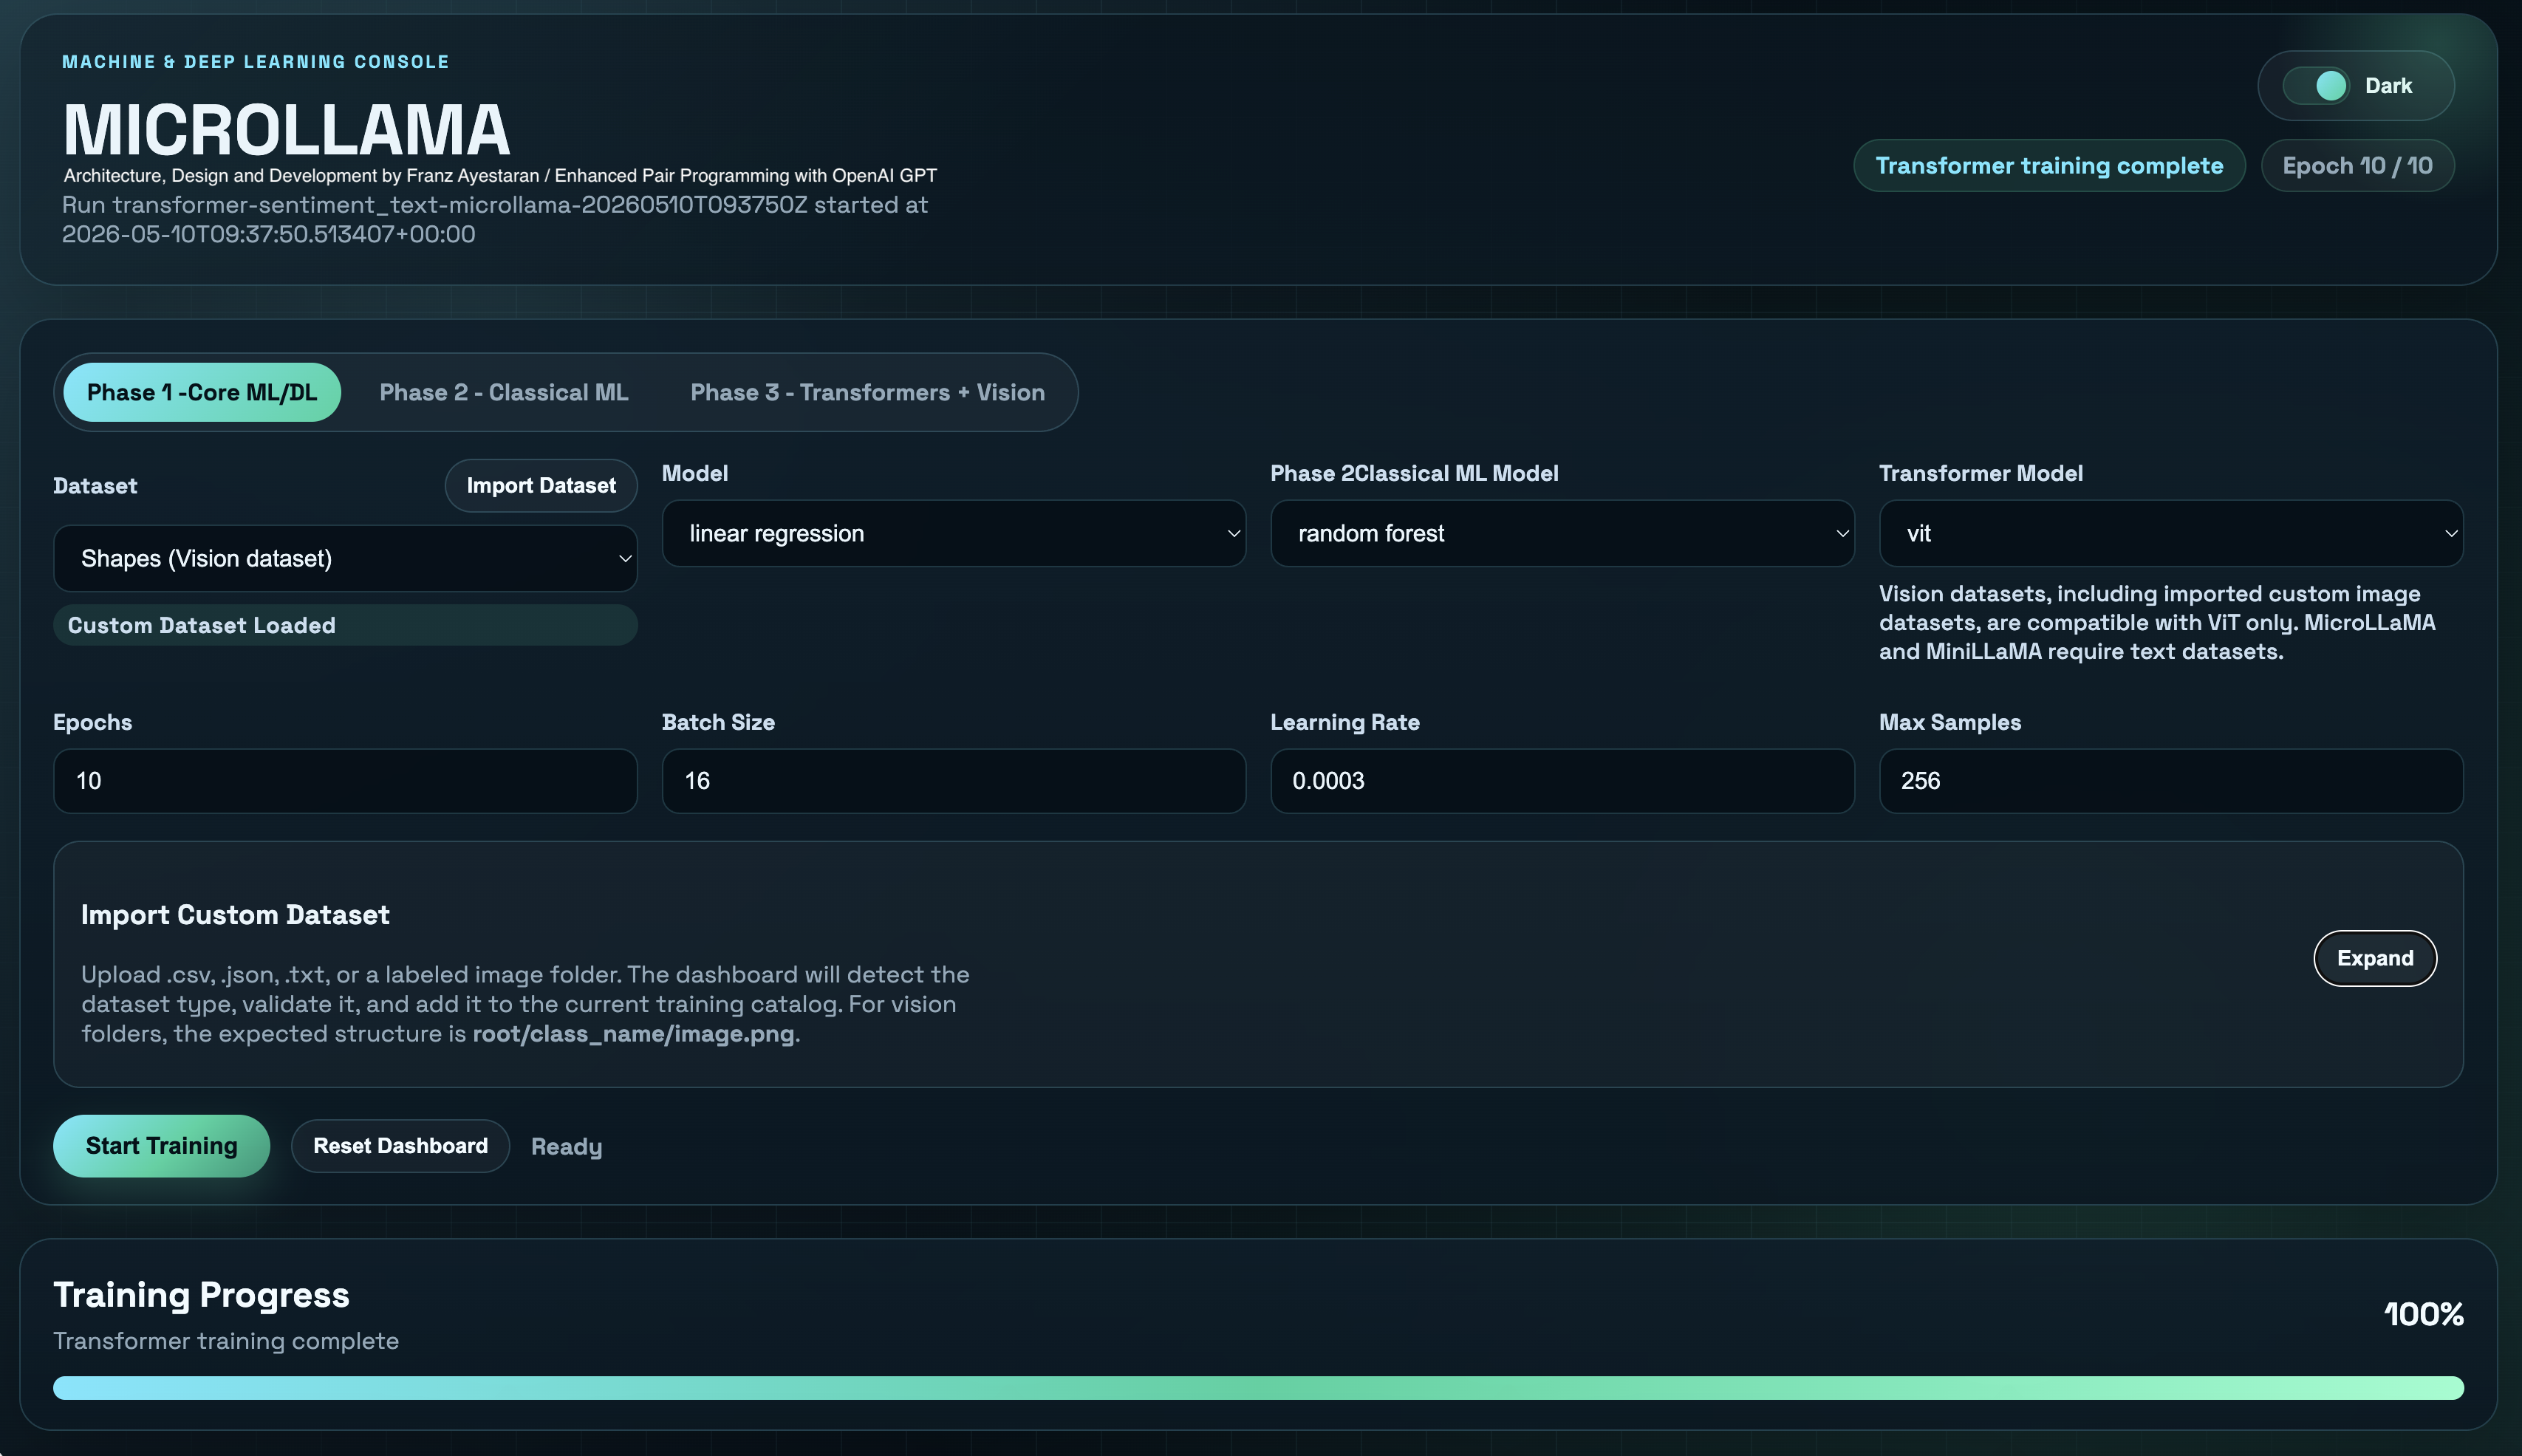
Open Web AppThe Machine & Deep Learning Console is a unified, browser‑native experimentation environment designed to make modern ML and DL workflows transparent, structured, and accessible. It consolidates dataset ingestion, model configuration, training execution, telemetry monitoring, interpretability tooling, and deployment‑ready export formats into a single cohesive interface. The console is built to support both classical machine‑learning pipelines and advanced deep‑learning architectures, including transformer‑based models and vision networks, enabling users to move fluidly between traditional statistical methods and state‑of‑the‑art neural systems. The platform organises training into three distinct phases — Core ML/DL, Classical ML, and Transformers + Vision — each providing specialised tooling and visualisation layers. Users can upload tabular datasets, text corpora, or labelled image folders, with the system automatically detecting the dataset type, validating structure, and routing it to compatible model families. This automated dataset intelligence allows seamless transitions between linear regression, random forests, neural networks, Vision Transformers (ViT), MicroLLaMA, MiniLLaMA, and other transformer‑based architectures. During training, the console provides real‑time analytical feedback through loss curves, accuracy trends, throughput metrics, GPU/CPU utilisation, VRAM/RAM consumption, inference latency, and epoch‑level telemetry. These insights allow users to observe how models learn, how performance evolves, and how computational resources are consumed across different architectures. The system also records complete run metadata, enabling reproducibility, cross‑phase comparison, and structured experiment tracking. For transformer‑based models, the console includes advanced interpretability tools such as ViT attention‑weight grids, token‑activation visualisations for MicroLLaMA and MiniLLaMA, and contextual weight inspection. These features expose the internal behaviour of transformer models, allowing users to explore how attention patterns form, how tokens influence predictions, and how model reasoning evolves across epochs. The environment supports deployment workflows through ONNX export, inference runners, and optional GGUF conversion for local execution via Ollama. Users can generate deployment scaffolds, run inference directly from the console, and inspect model outputs with full telemetry. This makes the system suitable not only for experimentation and learning, but also for practical integration into downstream applications.
DeepSpec MLX Dashboard
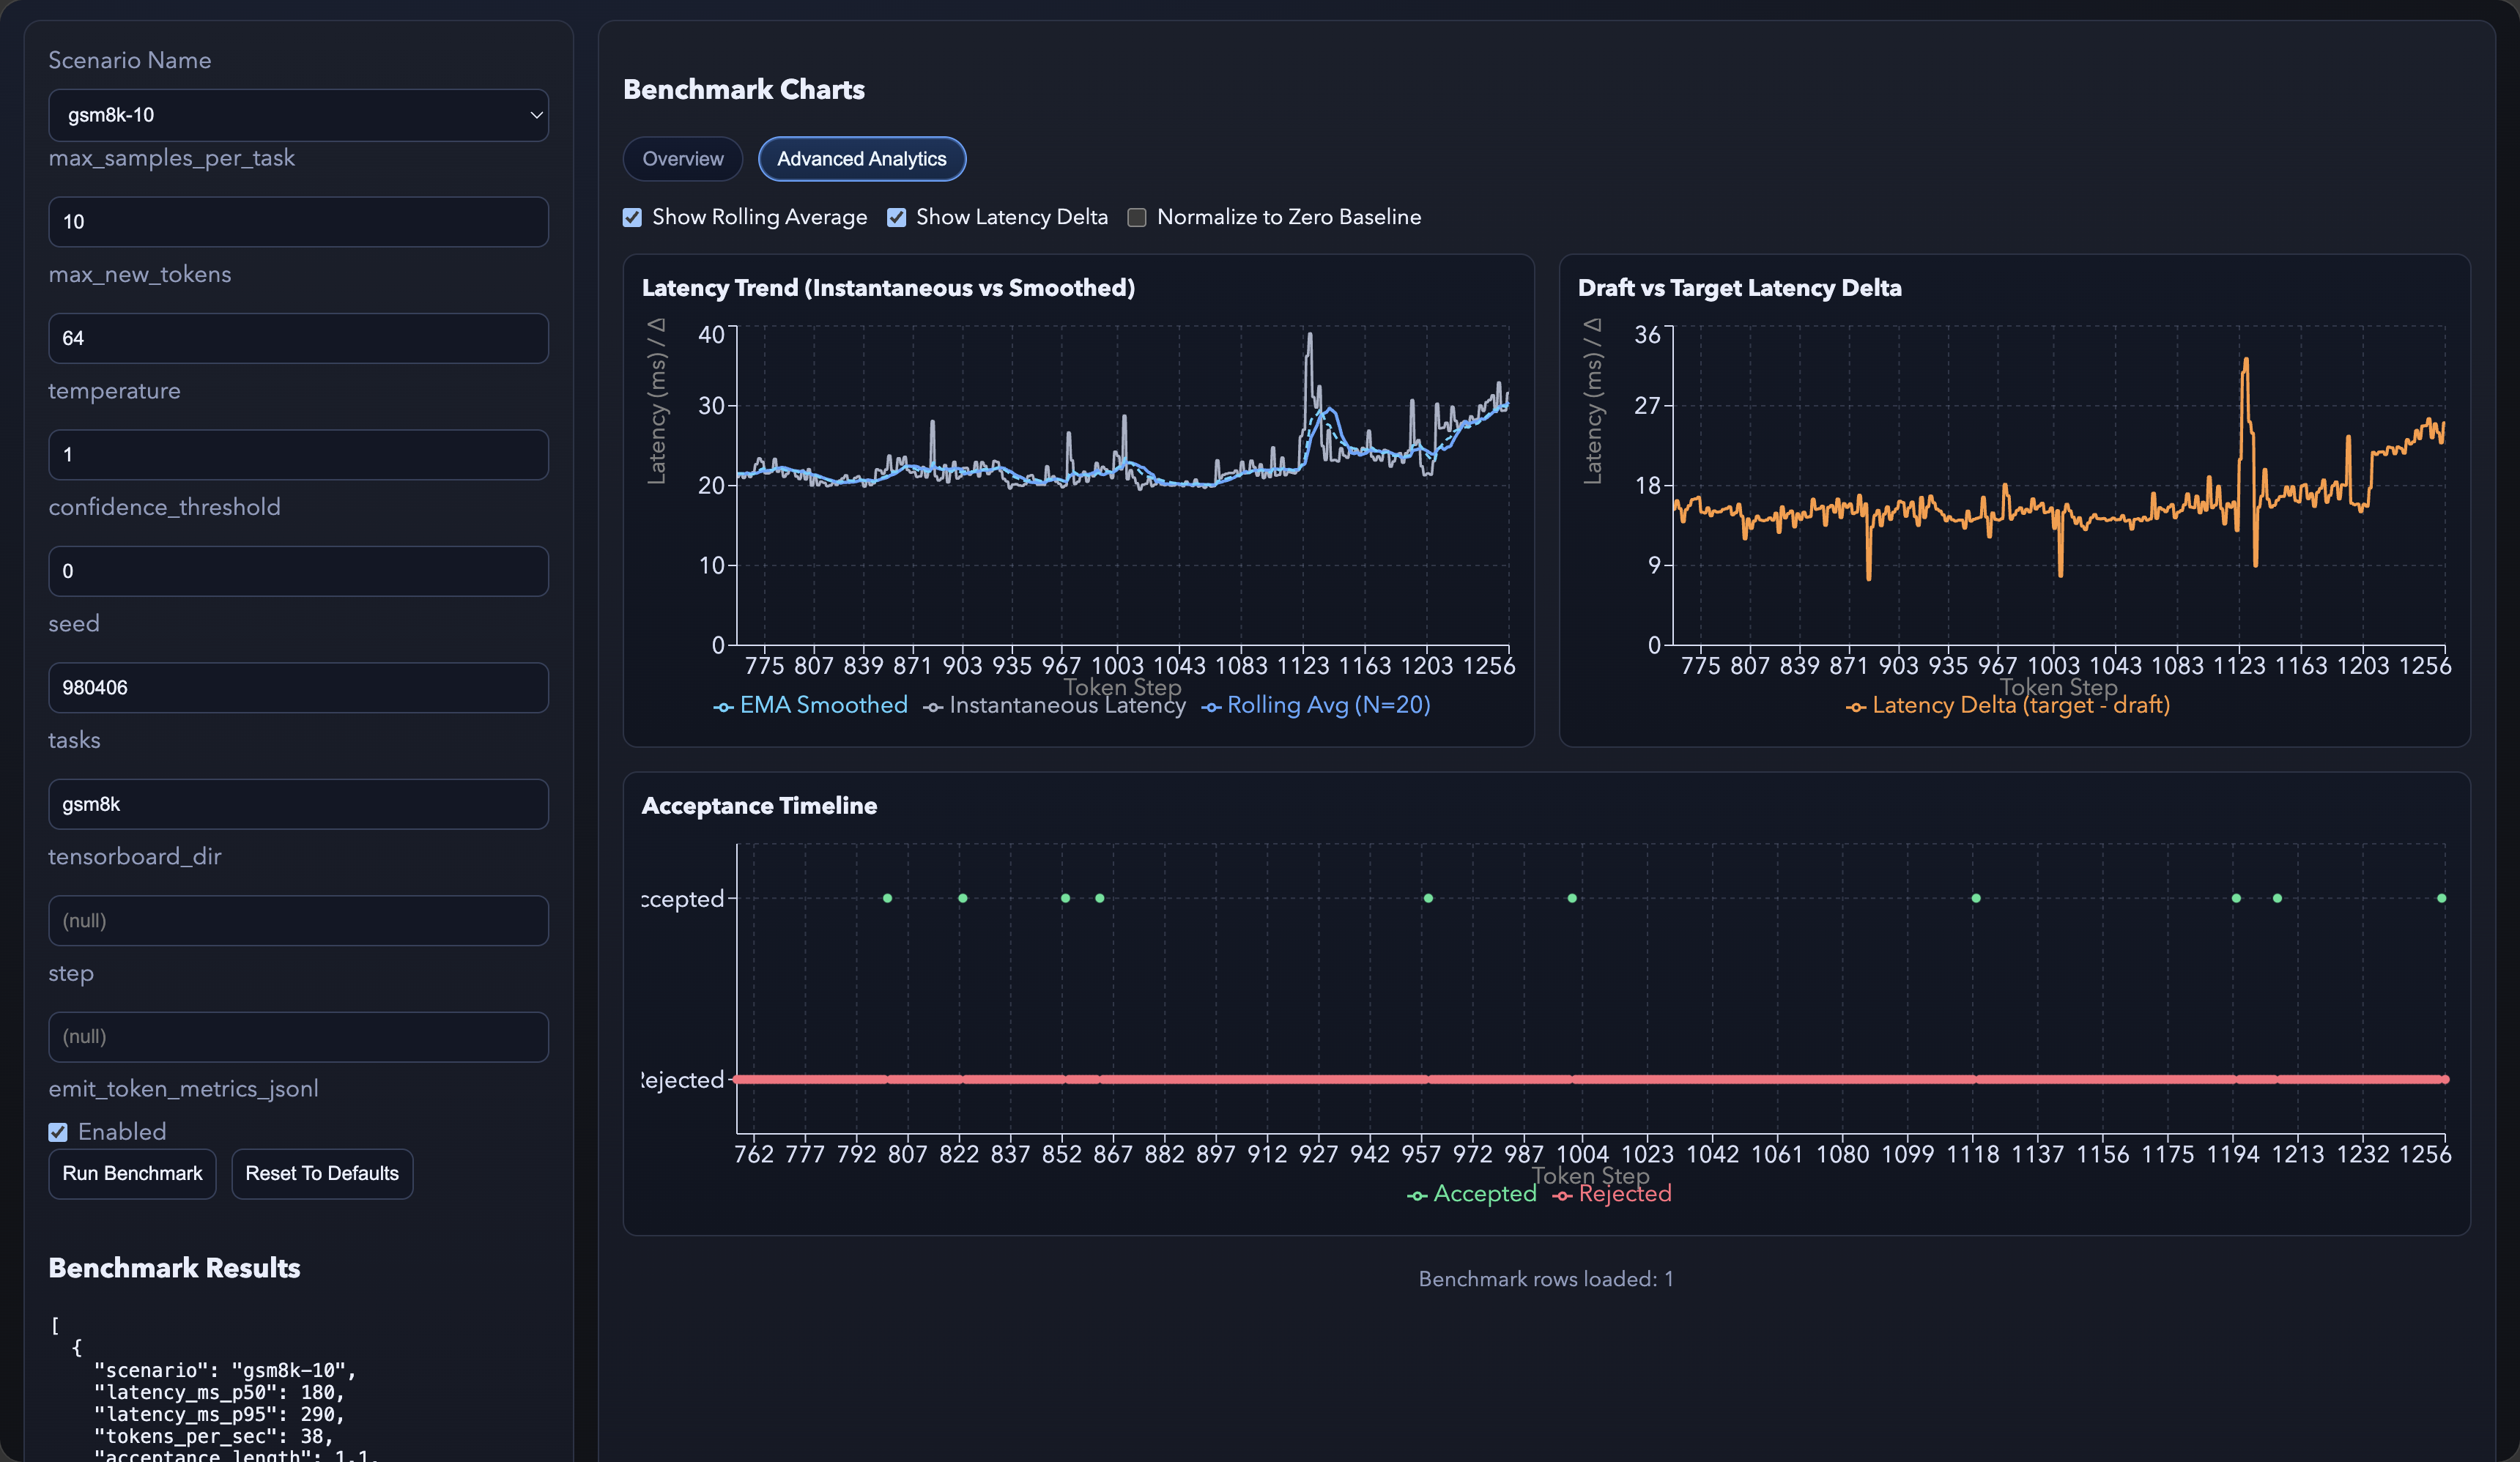
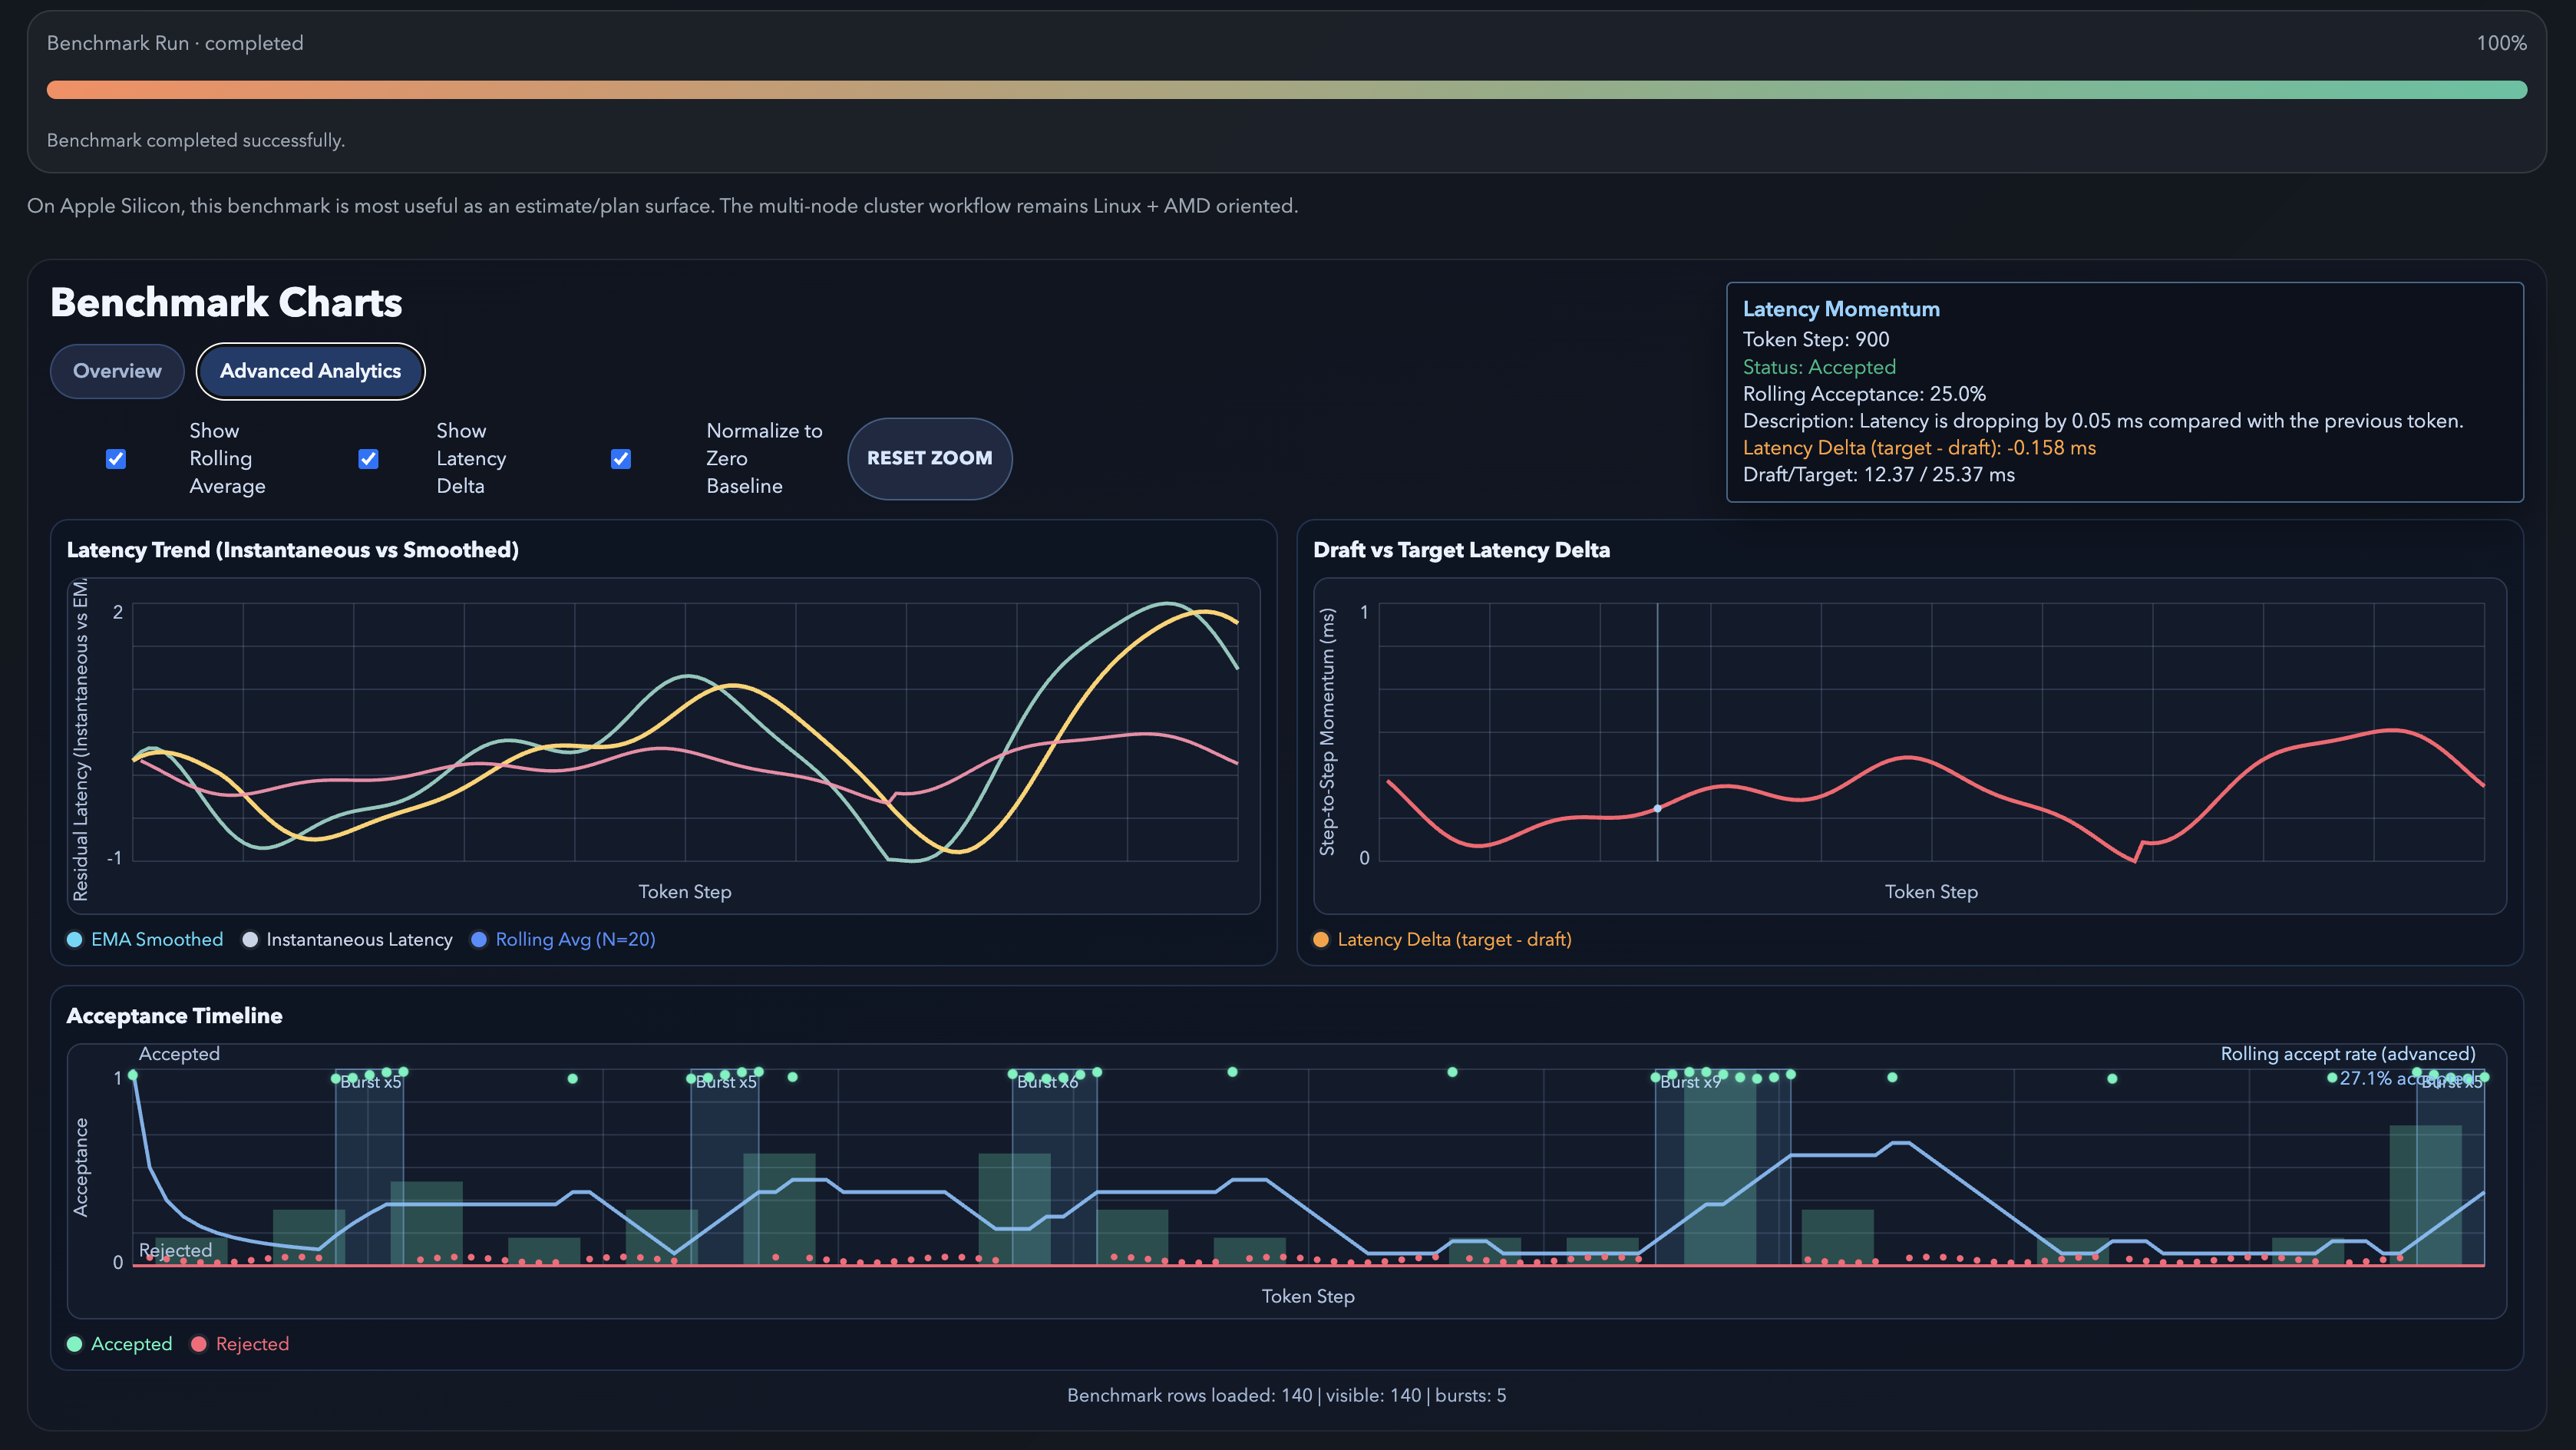
Open Web AppThe DeepSpec MLX Dashboard is a modern, Apple‑Silicon‑optimised environment that reimagines speculative decoding through an interactive and visual interface. Built entirely on MLX, it transforms the foundational ideas introduced in DeepSeek’s original DeepSpec repository into a developer‑friendly experience that runs seamlessly on Mac hardware. Instead of requiring multi‑GPU setups or deep CUDA expertise, the dashboard makes speculative decoding accessible to researchers, developers, and students through a clean browser interface. At its core, the dashboard provides a complete ecosystem for exploring, benchmarking, and visualising speculative decoding. The Regeneration Console allows users to compare draft and target model outputs interactively, revealing latency, acceptance, and verification patterns that explain how acceleration emerges. The Micro‑Benchmark Runner offers fine‑grained performance analytics, displaying latency trends, acceptance timelines, and draft‑versus‑target deltas through advanced charts. The Draft Model Playground enables live speculative decoding runs with adjustable parameters such as temperature and token limits, while the Token Flow Visualiser animates the decoding process in real time, showing how tokens are accepted, rejected, or regenerated step by step. Complementing these interactive modules, the Target Cache Explorer provides a detailed view of cached samples, sequence lengths, and input IDs, helping users understand model caching behaviour. The Model Inspector lets users load and examine MLX or GGUF models—such as Qwen3‑0.6B—and view architecture details, runtime configuration, and device mode. Integrated GGUF Conversion Tools make it easy to convert MLX, PyTorch, or Hugging Face models into GGUF format for deployment, with quantization presets and direct download options. A built‑in Export JSON Utility allows users to extract runtime configurations, benchmark results, and regeneration data for external analysis. Throughout the environment, a live System Status panel refreshes every two seconds, displaying CPU, memory, and GPU metrics alongside device information such as platform, architecture, and Python environment. This transparency ensures that users can monitor host performance as decoding runs unfold. Every component of the DeepSpec MLX Dashboard is designed to bridge the gap between research and practical application. It turns speculative decoding from a low‑level algorithm into a hands‑on, visual experience—one that makes acceleration dynamics intuitive, measurable, and deeply informative. By combining the inspiration of DeepSeek’s original research with the flexibility of MLX and the efficiency of Apple Silicon, the dashboard stands as both a tribute to the pioneering work of DeepSpec and a forward‑looking tool for modern AI experimentation.
Strix Halo X
Open Web AppSTRIX HALO X is the next evolution of the original Strix Halo LLM Fine‑Tuning Project on GitHub, re‑engineered into a universal dashboard that runs natively across CPU, CUDA, MPS, and ROCm. It inherits the foundational architecture and training logic of the original repository while introducing a refined control surface for real‑time orchestration of model workflows. At its core, STRIX HALO X unifies Training, Benchmark, Inference, and GGUF Export under a single adaptive runtime. The system automatically detects available compute backends and configures the environment for optimal performance—whether running on Apple Silicon, NVIDIA GPUs, or AMD accelerators. The Quick Smoke Test module provides instant validation of backend readiness by executing a lightweight LoRA pass on a small JSON dataset, confirming that dependencies, kernels, and memory allocation are stable before full‑scale training begins. The Jobs List serves as a live operational ledger, displaying queued and active runs with detailed metadata such as model type, dataset path, backend, and runtime duration. Each job is tracked through a Progress Bar that visualises epoch completion, token throughput, and quantisation stages in real time, offering a clear sense of momentum and completion. Complementing this is the new Graph View, a dynamic visualisation layer that renders training curves, loss trajectories, throughput trends, and memory utilisation over time. It transforms raw metrics into an immediate, intuitive picture of model behaviour, allowing users to diagnose instability, compare backend performance, and observe optimisation effects as they unfold. Benchmarking routines measure latency, throughput, and memory efficiency across all supported backends, while inference mode enables rapid validation of trained models using the same runtime configuration. The GGUF Export layer finalises the pipeline by converting checkpoints into portable, quantised formats ready for deployment in lightweight inference engines like Ollama or llama.cpp. Based on the original Strix Halo LLM Fine‑Tuning Project, STRIX HALO X represents Franz Ayestarán’s vision of a unified, hardware‑adaptive ecosystem—bridging fine‑tuning, evaluation, and deployment into a cohesive, visually intuitive workflow that feels native across every compute architecture.
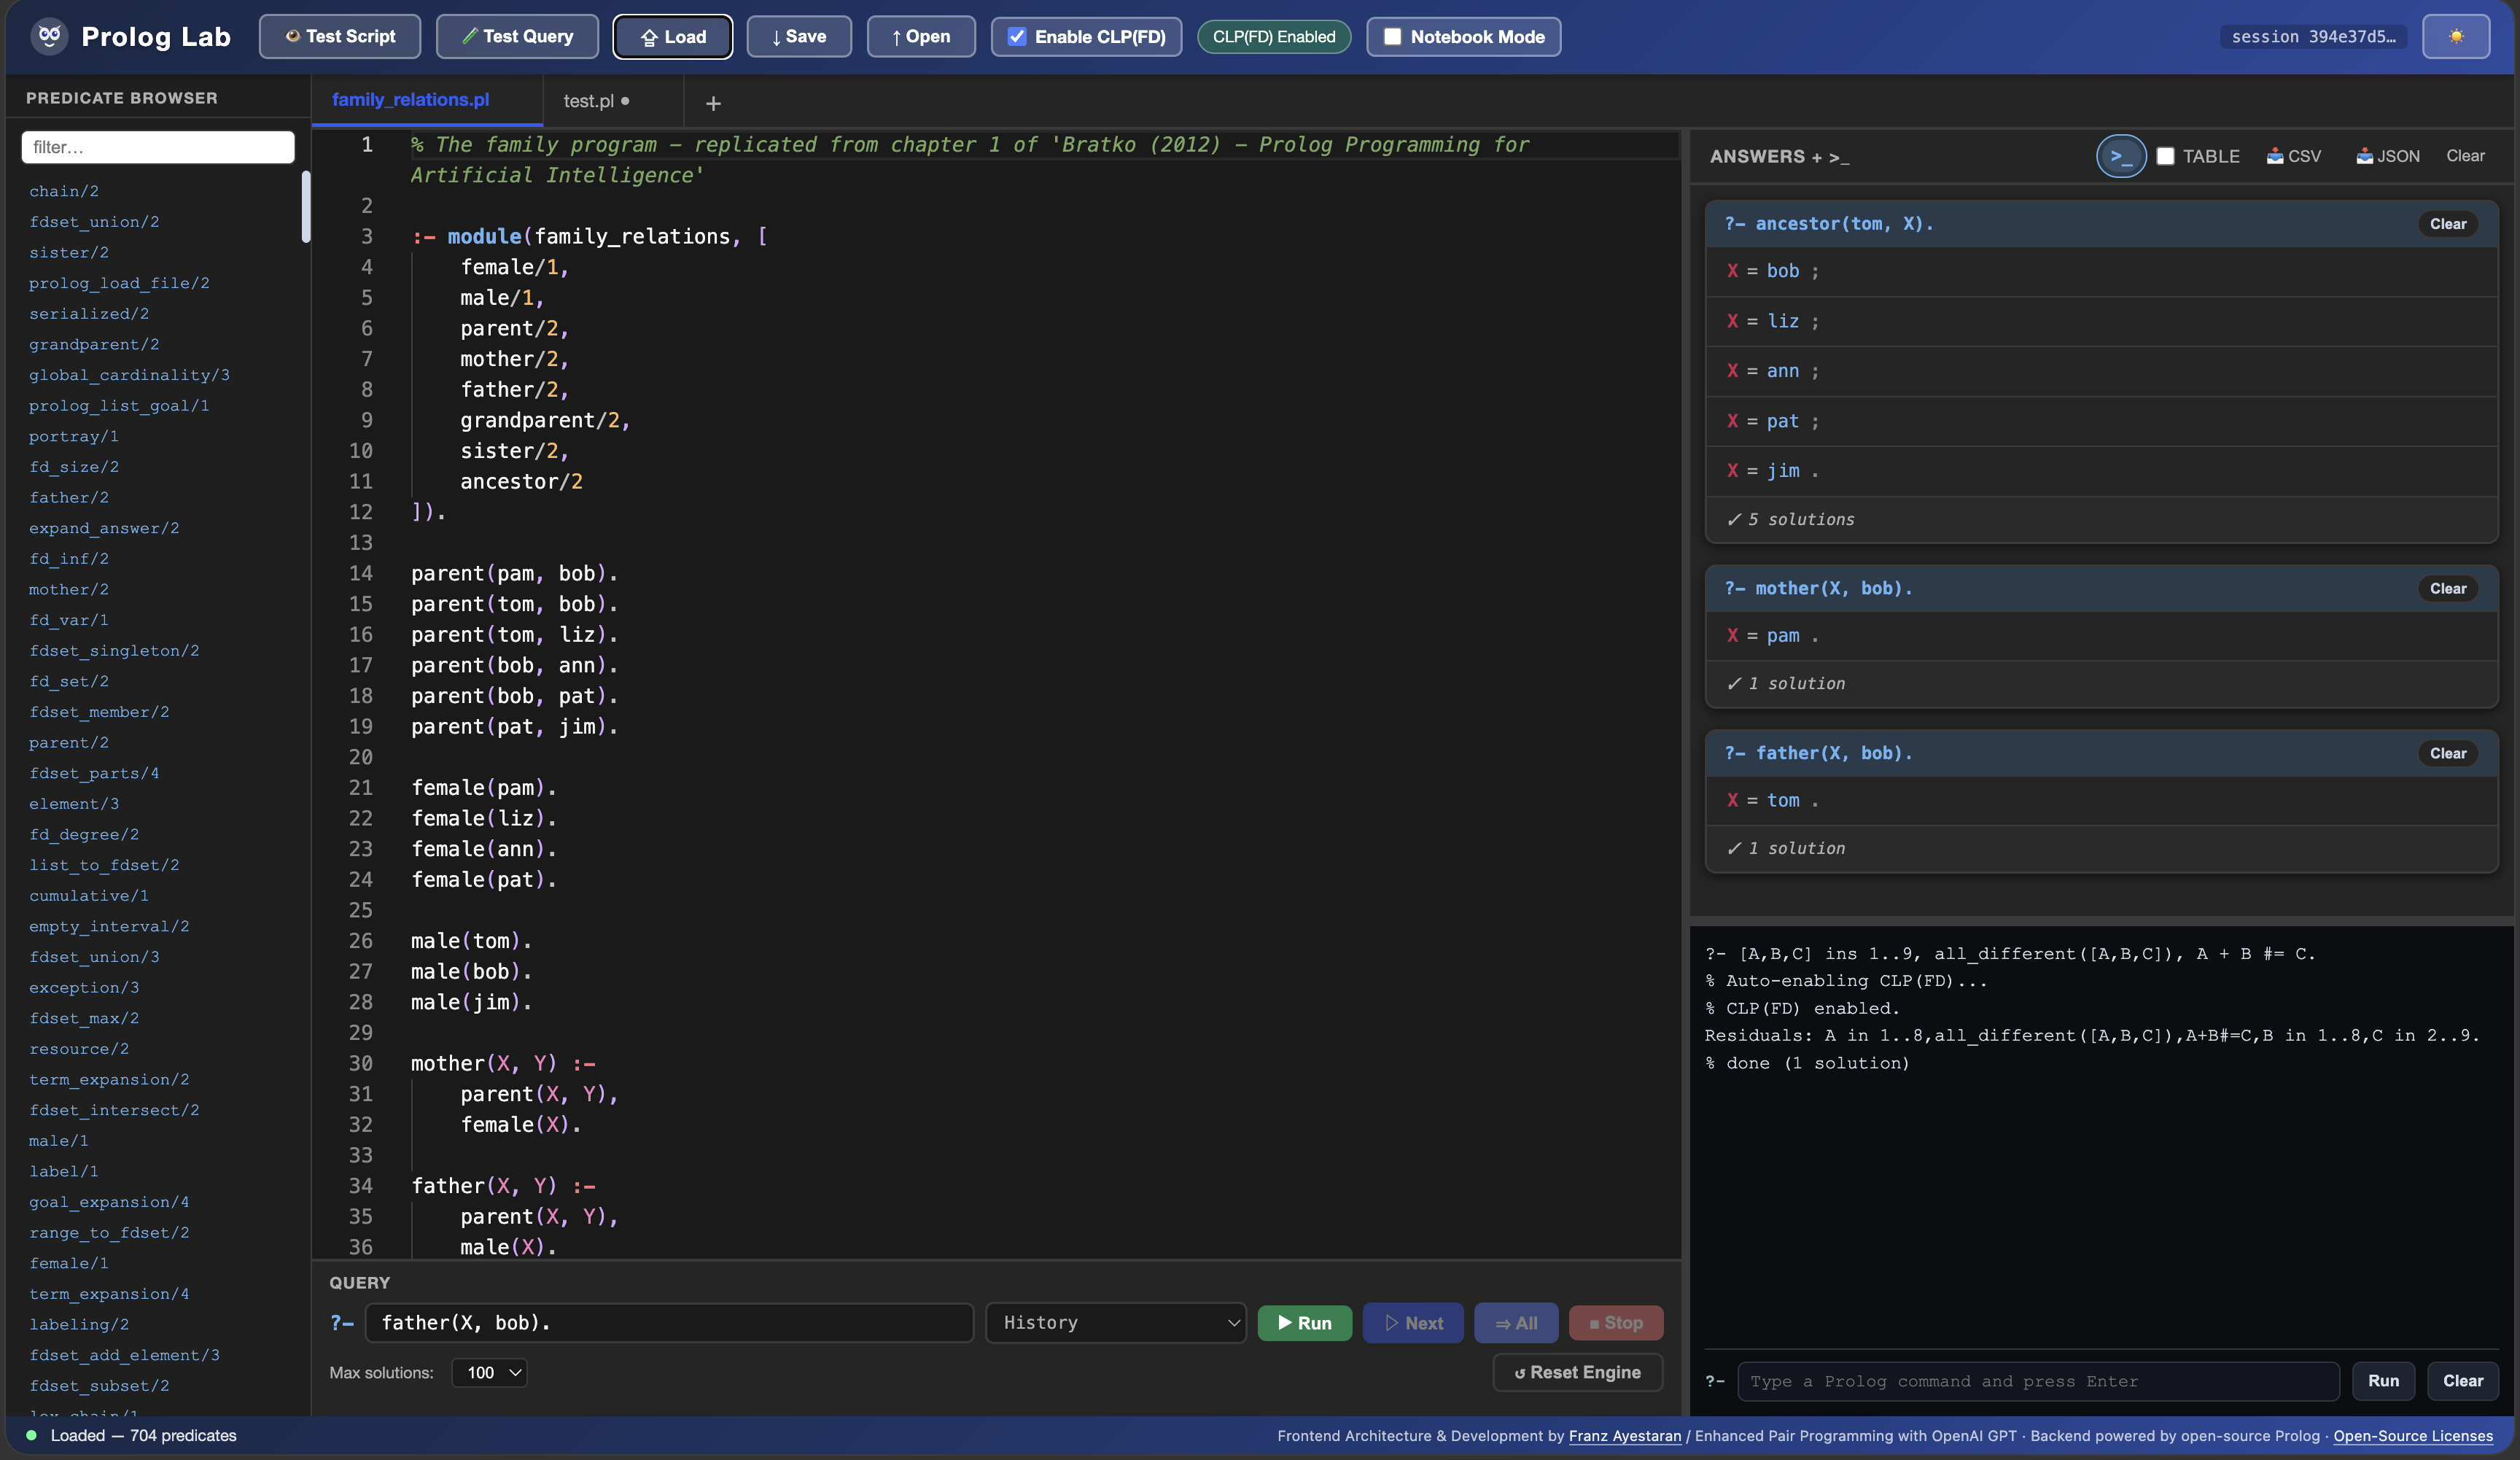
Prolog Lab
Open Web AppProlog Lab is a browser‑resident Prolog development environment designed as an academically rigorous platform for the study and practice of logic programming. It embeds a full SWI‑Prolog engine directly within the client, enabling a self‑contained computational logic workspace that requires no installation, external servers, or network‑dependent execution. The system supports the complete expressive range of modern Prolog, including recursive definitions, DCGs, modules, attributed variables, and CLP(FD) finite‑domain constraint solving, thereby providing an authentic environment for both foundational teaching and advanced experimentation. A central aim of Prolog Lab is to render the operational semantics of logic programming empirically observable. Program execution can be examined at the level of unification, backtracking, choice‑point management, constraint propagation, and variable‑binding evolution. This makes the environment particularly well suited for academic contexts in which the behaviour of the Prolog resolution mechanism is itself an object of study. Constraint‑based programs benefit from explicit domain‑state visualisation and propagation traces, allowing students and researchers to analyse solver behaviour with a degree of transparency rarely available in conventional IDEs. The environment integrates a fully functional terminal that reproduces the behaviour of the standard SWI‑Prolog REPL. Users can interact with the engine through the canonical ?- interface, consult and reload program files, inspect predicate definitions, and employ Prolog’s native debugging facilities. This terminal operates in concert with the visual execution tools, enabling a hybrid workflow that combines traditional REPL‑based reasoning with instrumented semantic inspection. Prolog Lab also provides persistent workspaces in which program files, editor tabs, and query histories are automatically preserved across page refreshes and browser restarts. This persistence transforms the system from a transient teaching tool into a stable research environment capable of supporting extended experimentation, iterative model development, and long‑running coursework. Taken together, these features position Prolog Lab as a compact yet powerful laboratory for computational logic. It is suitable for undergraduate and postgraduate teaching, for research in symbolic AI and constraint reasoning, and for exploratory work in knowledge representation, search strategies, and declarative problem‑solving. By combining a modern web interface with a fully embedded Prolog engine and deep execution introspection, Prolog Lab provides a technically robust and pedagogically rich environment for studying the principles and practice of logic programming.
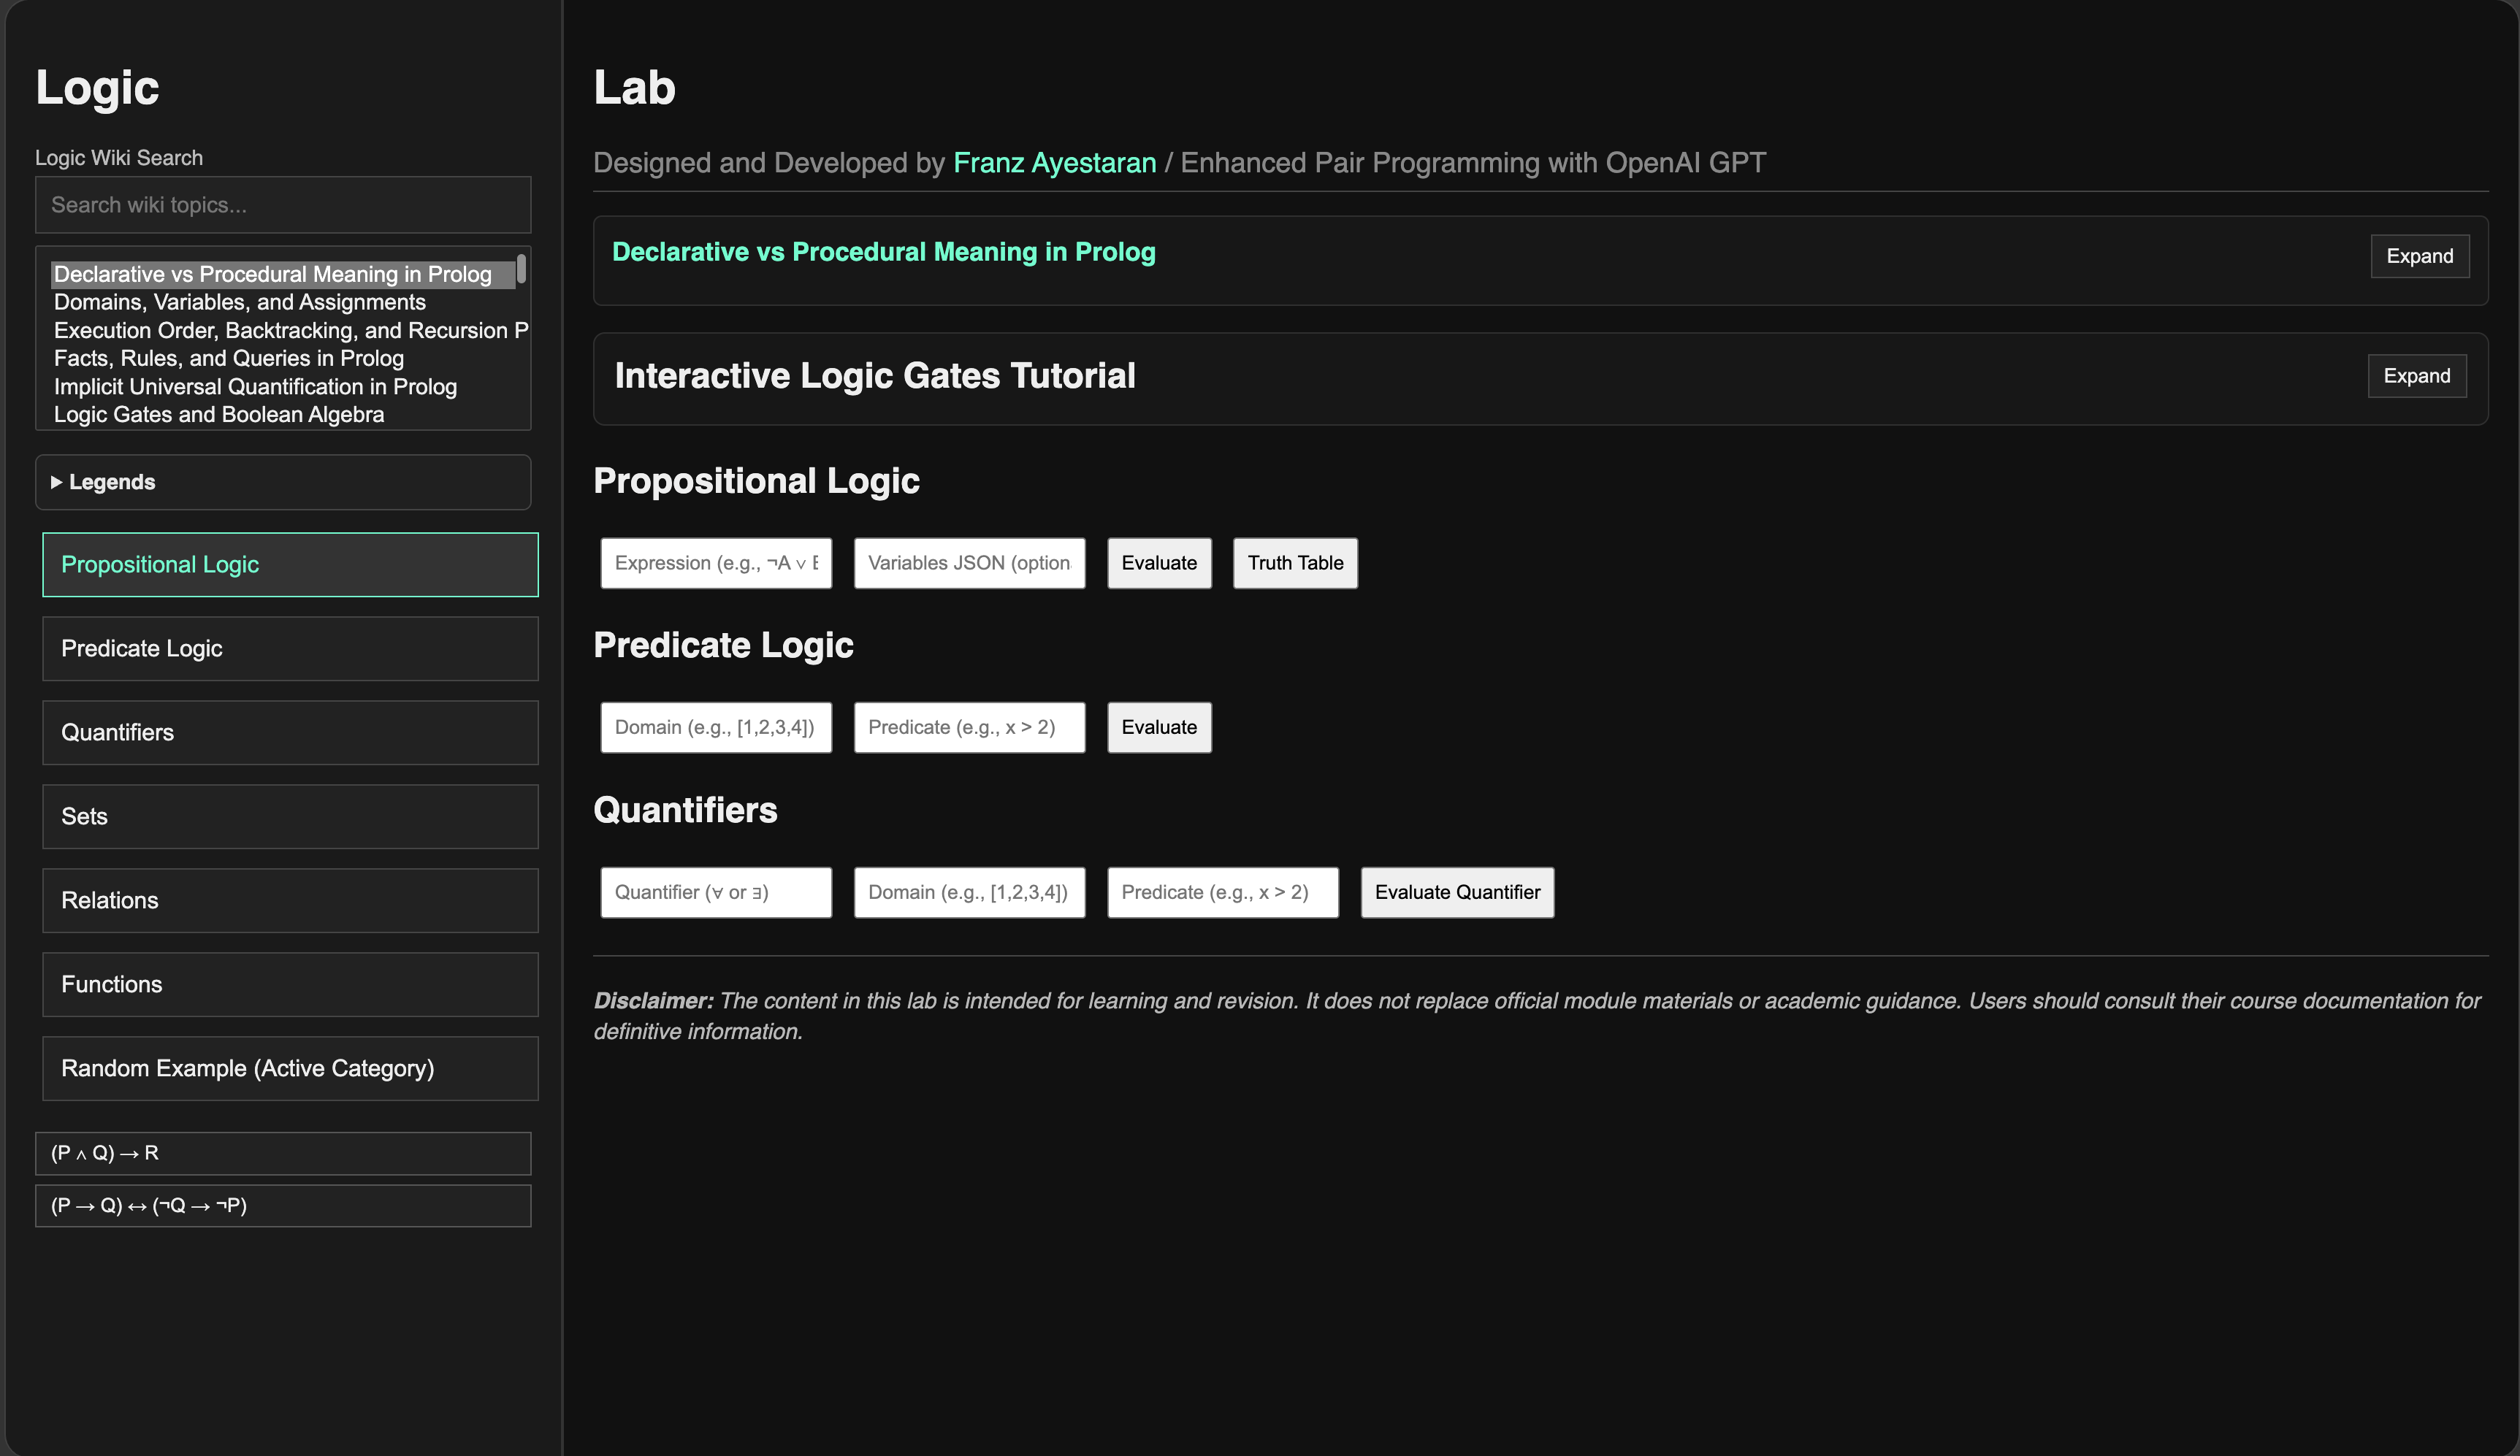
Logic Lab
Open Web AppLogic Lab is an interactive, browser‑based environment that provides a complete workspace for constructing, evaluating, and analysing formal logical expressions. The system supports both propositional and predicate logic, allowing users to enter formulas, define domains, specify predicates, and observe the resulting truth‑functional or quantifier‑based behaviour in real time. Logical expressions can be typed directly into the interface, where the system parses them, checks their structure, and evaluates them under all relevant assignments or interpretations. For propositional logic, Logic Lab generates full truth tables that display the behaviour of formulas across every possible valuation. Users can examine how connectives interact, how compound expressions reduce, and how logical consequence emerges from the relationships between propositions. The environment makes the evaluation process explicit by showing each intermediate step, enabling users to understand how formulas behave under different truth conditions. For predicate logic, the system allows users to define a domain and specify a predicate function, then evaluates universal and existential quantifiers over that domain. This makes it possible to test the validity of quantified statements, explore the effect of changing domains, and observe how predicate definitions influence logical outcomes. The interface provides immediate feedback, showing whether a quantified expression holds, fails, or depends on specific elements of the domain. Logic Lab also includes an integrated reference section that provides access to foundational topics such as quantifiers, satisfiability, models, Boolean algebra, execution order, recursion, and the relationship between propositional logic, predicate logic, and Prolog. Users can explore examples, revise core concepts, and connect theoretical material with practical evaluation tools. The environment supports iterative experimentation, allowing users to adjust formulas, modify domains, and test alternative interpretations without leaving the workspace. By combining expression parsing, truth‑table generation, quantifier evaluation, domain‑predicate testing, and integrated reference materials, Logic Lab offers a functional and transparent environment for learning, exploring, and applying formal logic. It provides a responsive and academically rigorous space in which logical structures become observable, manipulable, and open to systematic analysis.
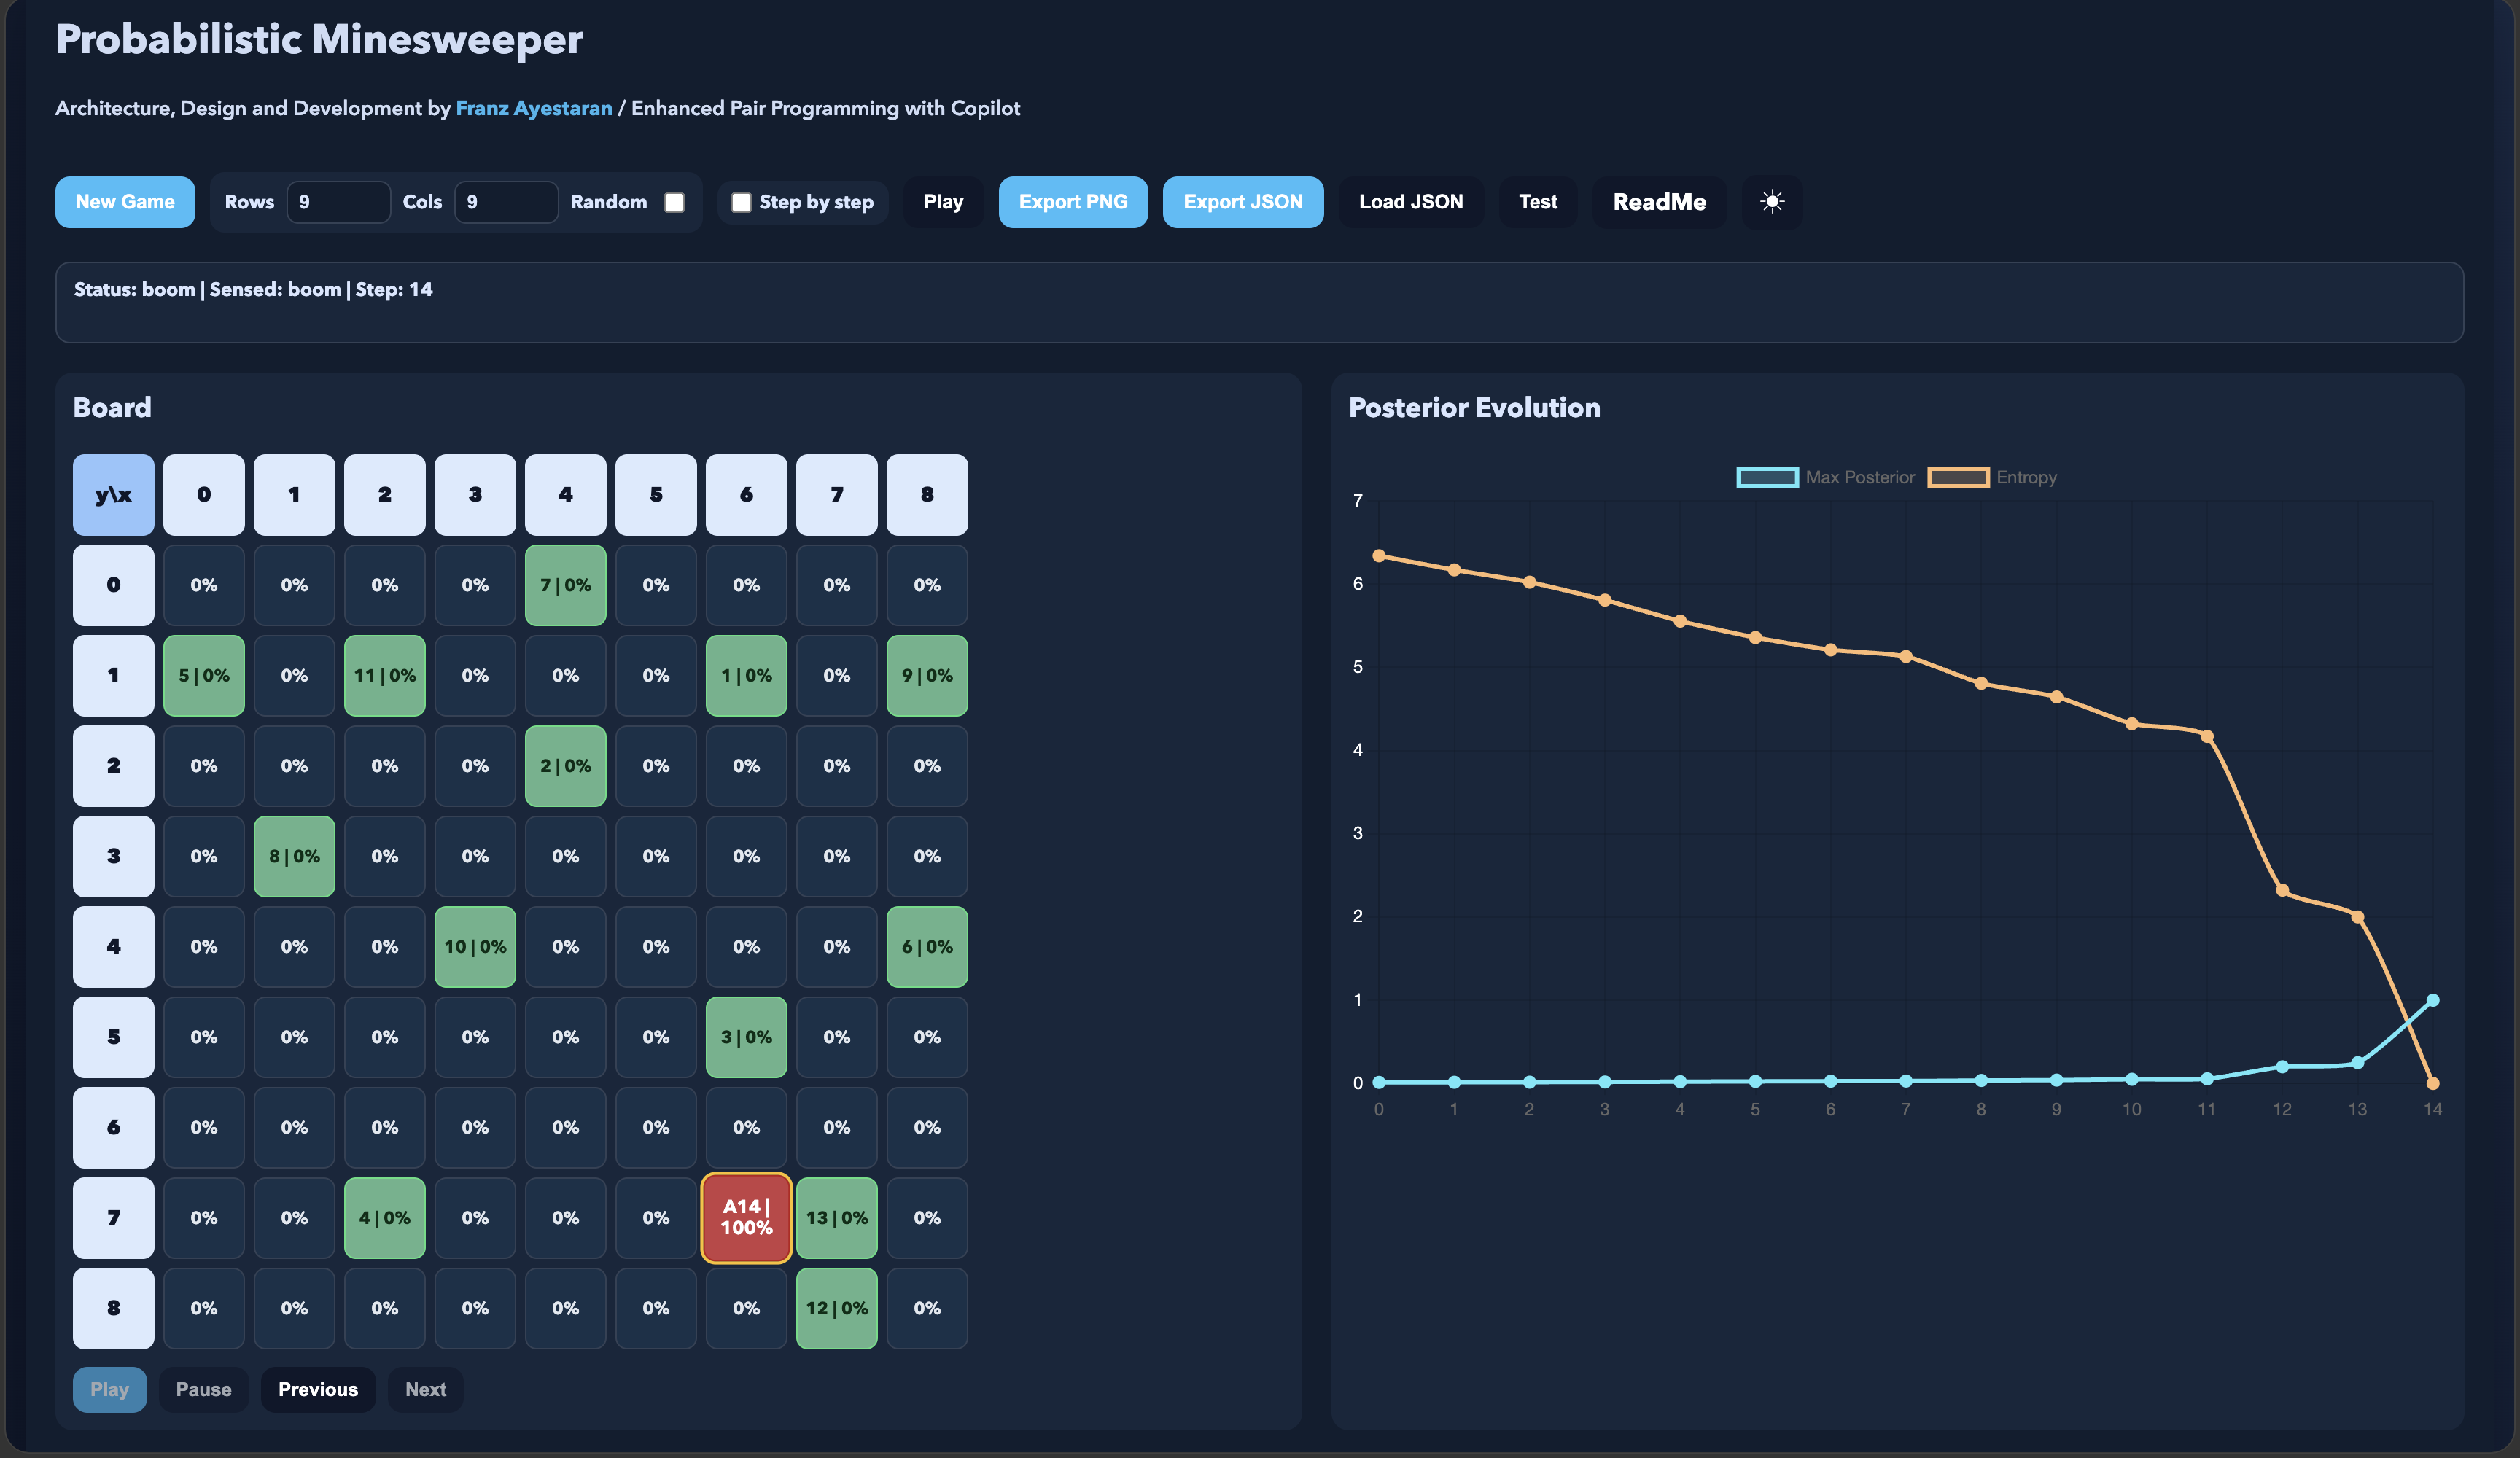
Probabilistic Minesweeper
Open Web AppProbabilistic Minesweeper is an interactive demonstration of Bayesian reasoning applied to a grid‑based search problem. The app models an autonomous agent exploring a hidden‑mine environment and continuously updating its beliefs about the mine’s location based on sensory feedback. Each move produces one of three outcomes—boom, adjacent, or nothing—and the system immediately recalculates a posterior probability distribution over all grid cells. The interface visualises these updates as a dynamic probability heatmap that evolves in real time as the agent explores the board. Posterior Evolution provides a chronological record of every probability distribution generated during the run. Each frame captures the agent’s belief state at a specific step, allowing users to observe how the posterior sharpens, shifts, or collapses as new evidence arrives. This creates a complete inference timeline that can be replayed or exported for analysis. Probability History (Top Cells) highlights the most likely mine positions at each step. Instead of showing the full distribution, this view focuses on the top‑ranked cells and how their probabilities rise or fall over time. It offers a concise way to understand the agent’s decision pressure and how competing hypotheses evolve as the agent gathers more information. Tried Positions Array (x, y) records every location the agent has visited. Each entry shows the exact grid coordinates of the agent’s movement history, forming a trace of its exploration strategy. This array makes it easy to reconstruct the agent’s path, understand why certain cells were chosen, and analyse how the agent balances exploration with probabilistic reasoning. The Status Log provides a step‑by‑step narrative of the agent’s experience. It reports the sensed outcome at each position, the inferred directional likelihoods when an adjacent signal is detected, and the agent’s internal state transitions. The log acts as a readable explanation of the inference process, making the underlying reasoning transparent and accessible. The demo includes full playback controls. Users can pause the autonomous agent at any moment, step backwards to review earlier inference states, or step forwards to examine the next update in detail. This makes the system ideal for teaching, debugging, and exploring probabilistic reasoning at a granular level. Together, these features illustrate how Bayesian inference enables autonomous agents to navigate uncertainty, refine hypotheses, and progressively narrow down hidden variables in environments inspired by Minesweeper and Wumpus World. The app is designed for clarity, reproducibility, and educational value, offering a complete visual and analytical view of probabilistic decision‑making in action.
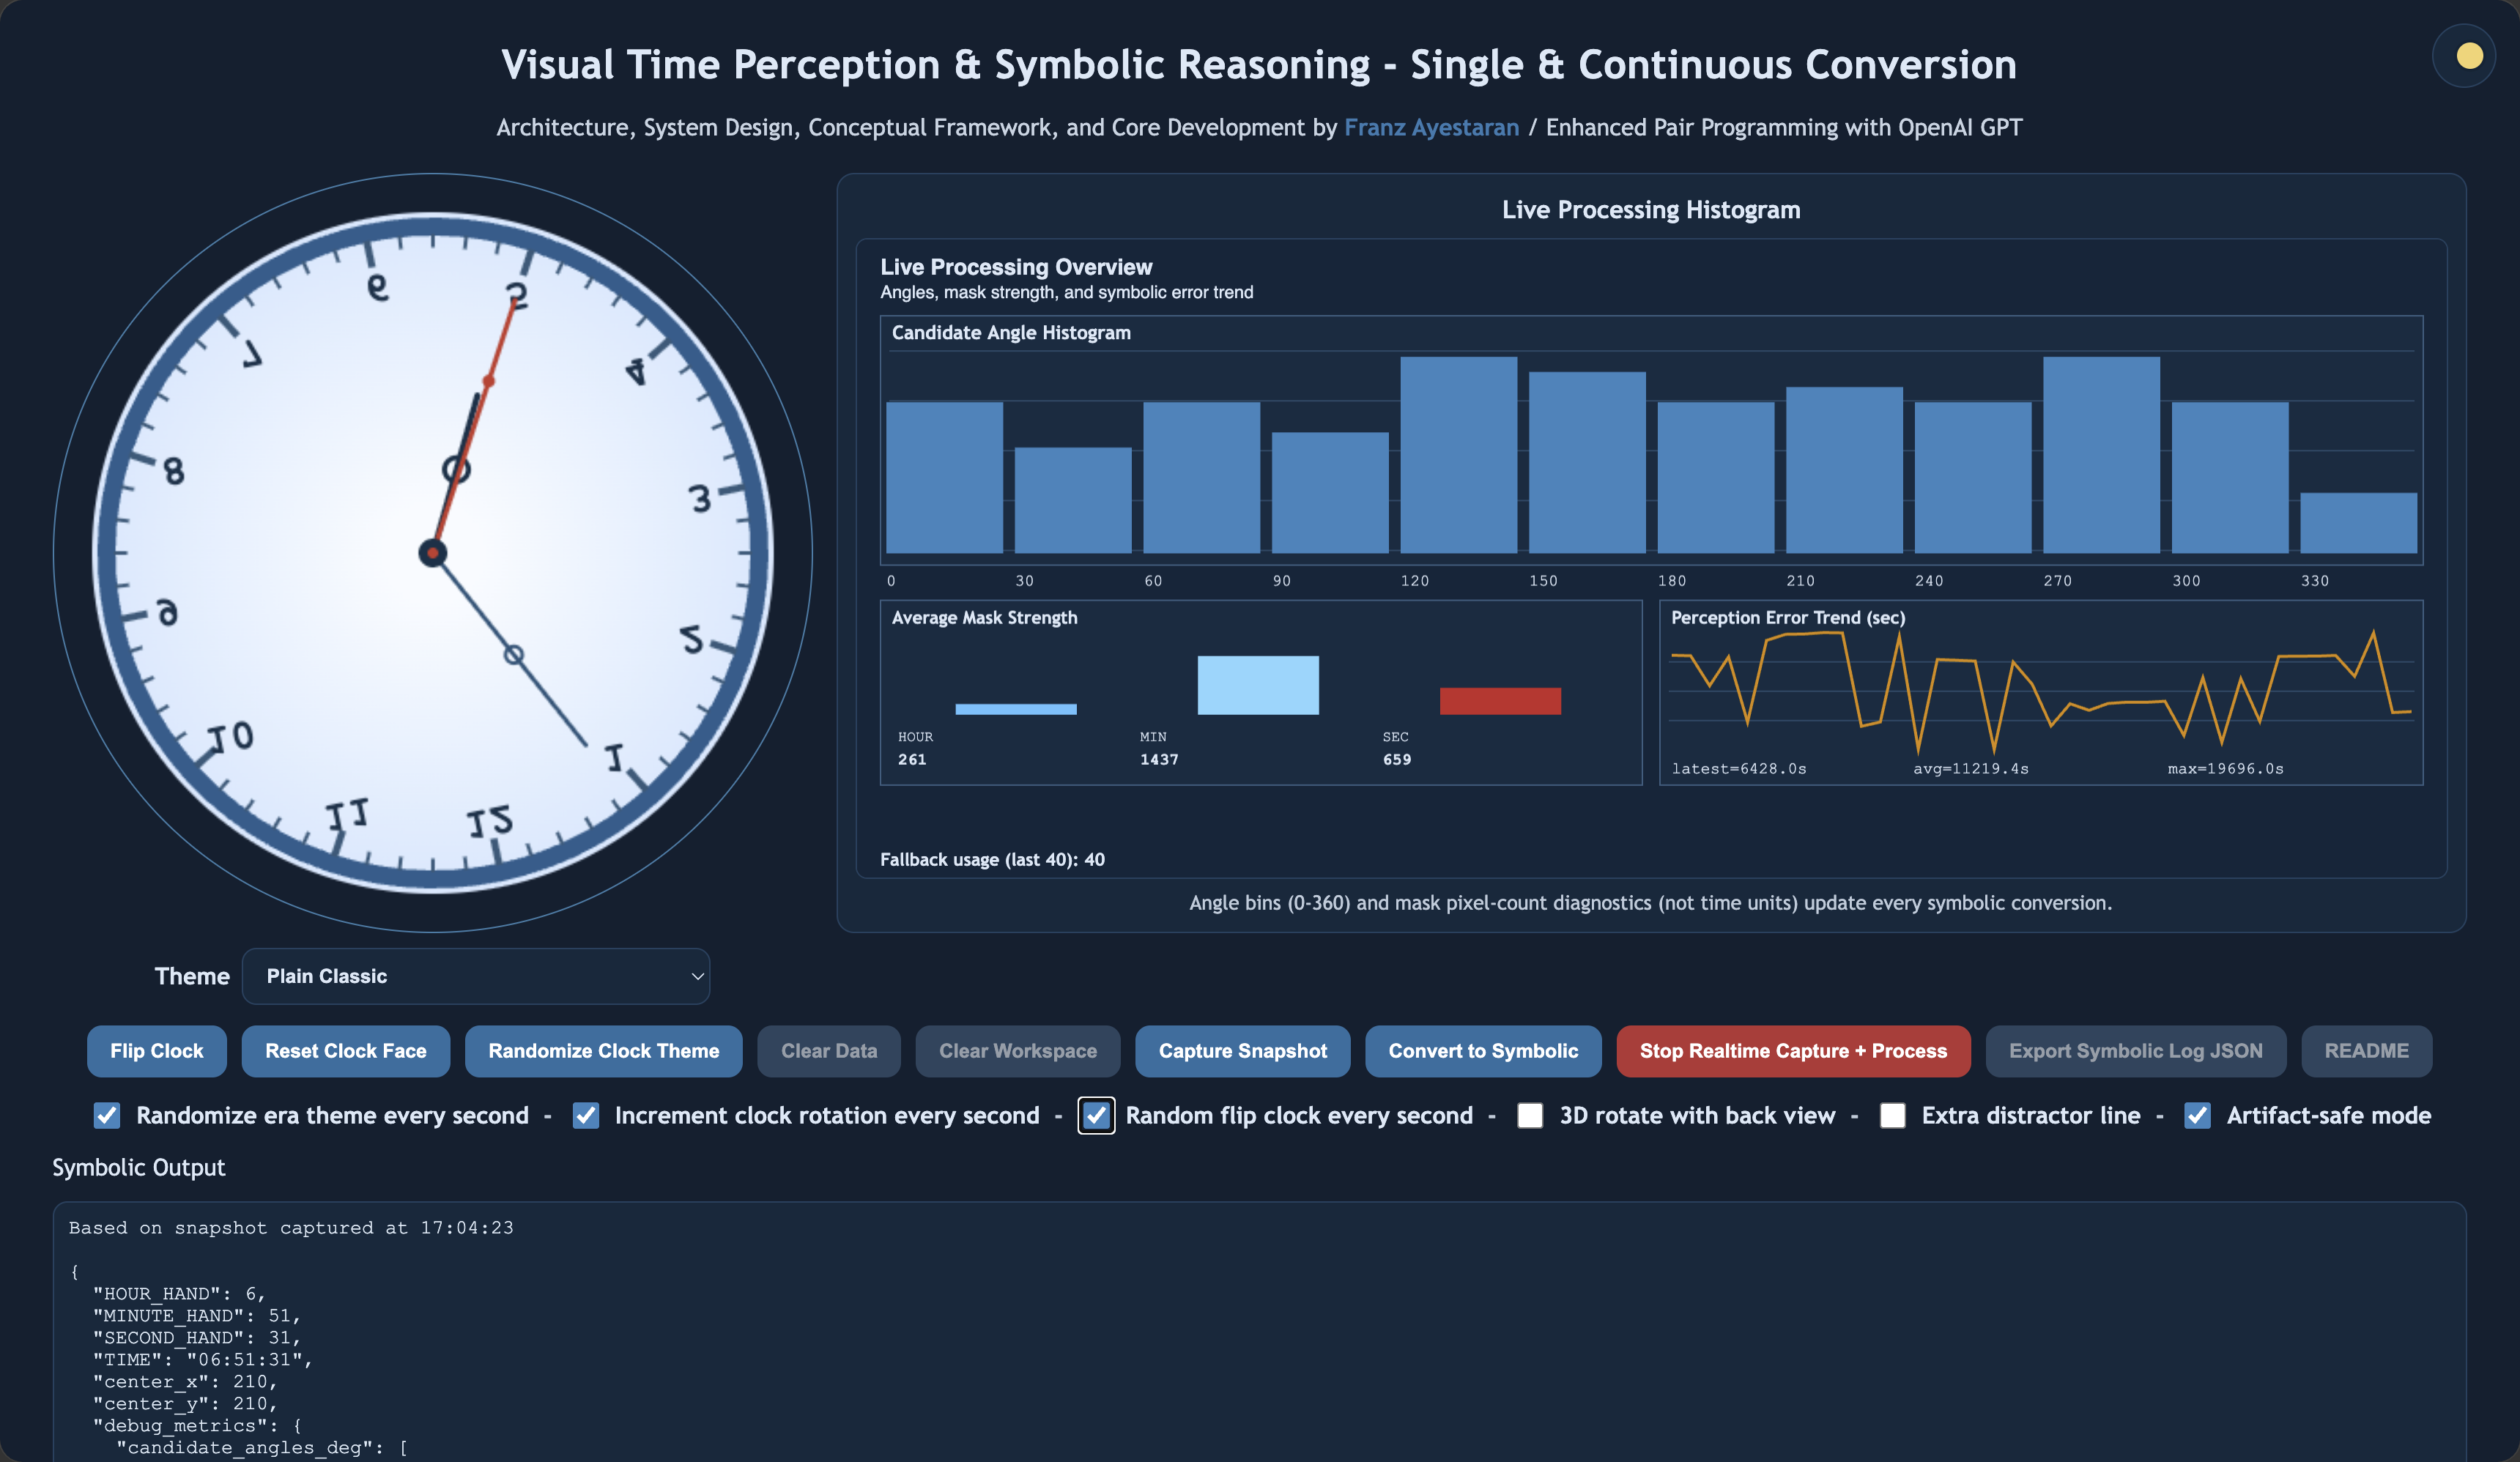
Visual Time Perception & Symbolic Reasoning
Open Web AppSymbolicReasoning.llmtraining.dev is an interactive research environment that transforms visual time perception into structured symbolic logic through continuous computation. It forms part of the LLMTraining.dev ecosystem and demonstrates how perceptual reasoning can be expressed as symbolic structure within an AI‑augmented development workflow. At the centre of the environment is the Symbolic Canvas Clock, a dynamic visual interface where each frame of an analog clock is captured, analysed, and converted into symbolic data. The system performs real‑time frame interpretation using a colour‑mask segmentation pipeline with Hough‑transform fallback. Each conversion produces a symbolic snapshot containing interpreted time, geometric centre, hand‑angle estimates, candidate‑angle distributions, pixel‑mask diagnostics, fallback usage, and detection confidence. The Live Processing Histogram visualises evolving angle bins and mask pixel‑count behaviour, updating continuously as the conversion engine processes each frame. Users can flip the clock, reset the face, randomise themes, clear the workspace, enable 3D back‑view rotation, introduce distractor lines, activate artifact‑safe mode, and run continuous capture and processing cycles. Every conversion includes a pipeline summary that exposes how the system interprets shape, angle, and spatial relationships. A major extension of the environment is the Visual Processing Artifact System, which captures, displays, and exports every stage of the computer‑vision pipeline used during symbolic conversion. Each processed frame now generates a complete visual record, including a final processed‑image preview and a full suite of OpenCV intermediate stages — grayscale conversion, Gaussian blur, edge detection, colour‑mask segmentation, and Hough‑transform overlays. These artifacts reveal how the perception pipeline transforms raw geometry into interpretable structure, providing a transparent view of the system’s visual reasoning. Each stage includes diagnostic metadata such as pixel‑mask counts, threshold ranges, fallback usage, and component‑detection behaviour. All artifacts can be individually downloaded as PNGs or exported together as a reproducible bundle, enabling detailed offline inspection, dataset augmentation, and integration into external research workflows. The Processed Image panel presents the final interpreted frame exactly as the symbolic engine saw it, while the OpenCV Processing Stages gallery allows users to explore each transformation step in full resolution. The Grounding Preset Studio provides a modular system for designing and testing perceptual‑grounding strategies. Users can drag presets from the library — including Baseline Clean Grounding, Roman‑Numeral Anchoring, Theme Domain Shift, Rotation Invariance, Flip Invariance, Back‑View Invariance, Artifact Resilience, and Plain Reference Reset — into the Script Generator to compose reproducible grounding experiments. These presets shape how the system interprets perceptual input, turning the environment into a controlled grounding laboratory where visual conditions can be systematically manipulated, sequenced, and exported. The Script Generator allows presets to be added, applied, copied, or cleared, producing a grounding script that governs how the symbolic engine processes incoming frames. The Generated Dataset module transforms the continuous symbolic stream into supervised training samples suitable for fine‑tuning large language models. For each frame, the system can generate natural‑language interpretations, next‑state predictions, anomaly and error‑detection samples, debug‑metric explanations, and concise human‑friendly descriptions. Users can optionally embed processed images and OpenCV stages into dataset samples, allowing models to learn from both symbolic reasoning and the perceptual transformations that produced it. All generated samples appear in a dedicated dataset panel, where they can be searched, collapsed, copied, and exported as JSONL for direct use in the LLMTraining.dev training workflow. A major extension of the environment is the Reproducible Experiments system, which enables controlled sweeps across grounding conditions. Users configure sample counts and statistical‑iteration budgets, then run full sweeps that produce condition matrices, metrics CSVs, stats CSVs, and statistical summaries. When visual‑artifact capture is enabled, each experiment also produces a complete archive of processed images and OpenCV stages for every sampled frame, allowing researchers to correlate symbolic accuracy, fallback behaviour, and pixel‑mask dynamics with specific grounding conditions. The interface provides real‑time status indicators — Idle, Queued, Sampling, Stats, Done — and displays experiment artifacts once a sweep completes. This system allows grounding strategies to be evaluated under repeatable conditions, producing structured experimental evidence for symbolic‑reasoning behaviour. The LLM Benchmark Comparison module allows users to evaluate symbolic‑reasoning datasets against multiple language models. Benchmarks can be run across models such as llama3.2:3b and gemma3:4b, with configurable question counts and timeouts. The system generates question sets, model responses, evaluation metrics, and statistical analyses including ANOVA and Tukey reports. Benchmark questions can reference processed images, OpenCV stages, or diagnostic metadata, enabling models to reason about the perceptual pipeline itself. All benchmark artifacts — questions, evaluations, visual bundles, and stats summaries — can be downloaded, filtered, and inspected directly within the interface, enabling end‑to‑end assessment of how different models interpret symbolic‑reasoning tasks derived from perceptual input. By bridging perception, symbolic logic, grounding strategies, dataset generation, reproducible experimentation, visual‑processing artifacts, and LLM benchmarking, Symbolic Reasoning illustrates how meaning can emerge purely from geometry and computation. It stands as both a visual experiment and a cognitive model, showing how an AI system can learn to reason symbolically from the world it perceives — and how those symbolic structures can be stress‑tested, benchmarked, and used to train modern language models.
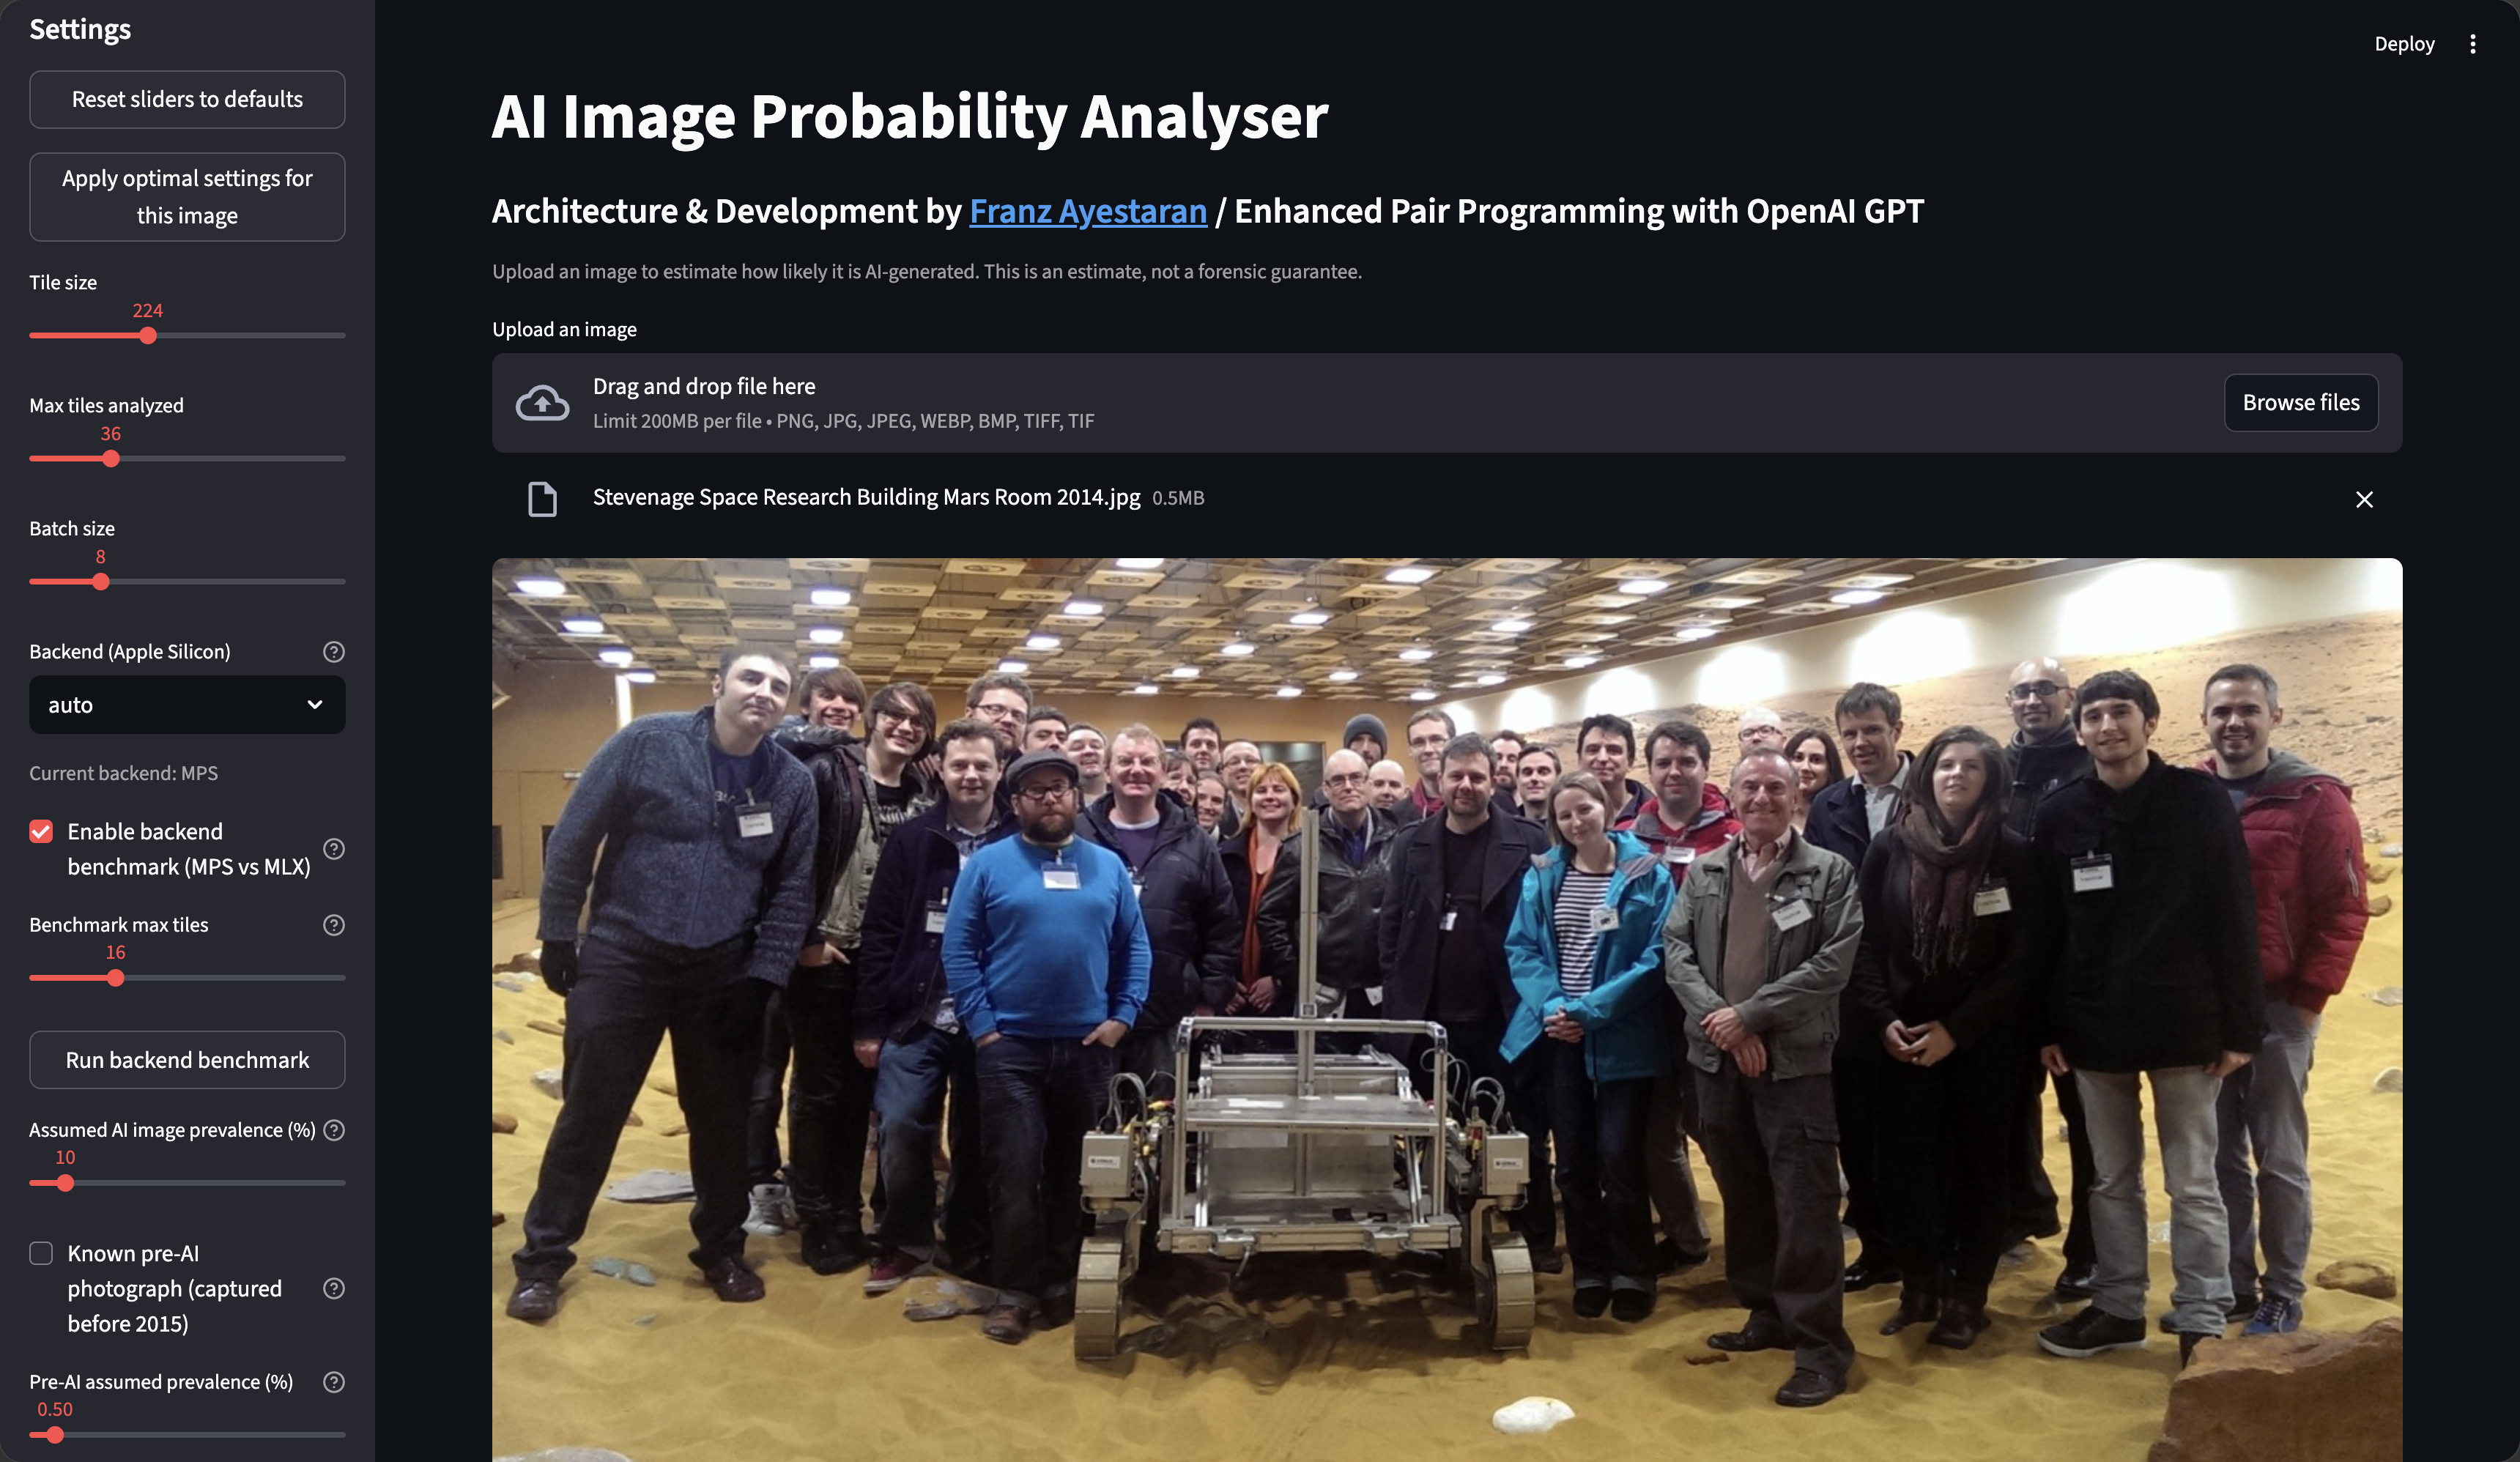
Ai Image Probability Analyser
Open Web AppThe AI Image Probability Analyser is a research‑grade evaluation tool designed to estimate how likely an image is AI‑generated by combining semantic modelling, forensic signal analysis, and contextual priors into a single interpretable probability. Its purpose is to give users a transparent, evidence‑driven understanding of an image’s origin rather than a simplistic real‑versus‑fake verdict. The analyser processes every uploaded image through a tile‑based pipeline, allowing fine‑grained inspection of local features and compression patterns. It automatically selects the optimal Apple‑Silicon backend and can benchmark MPS against MLX to ensure consistent performance. Users can adjust tile size, batch size, prevalence assumptions, inconclusive zones, and consensus weights, making the tool adaptable to both casual inspection and more rigorous analytical workflows. Once an image is uploaded, the analyser extracts and displays EXIF metadata, surfacing camera make and model, timestamps, resolution fields, and orientation data. These metadata signals feed into a non‑AI artifact subsystem that evaluates natural sensor noise, JPEG quantization tables, and historical plausibility. When strong non‑AI evidence is present, such as a valid capture timestamp or authentic camera metadata, the system applies a controlled prior reduction to avoid false positives. This evidence adjustment is quantified and shown to the user, making the reasoning process visible rather than hidden. The core inference engine blends two independent models: a CLIP‑based semantic classifier that evaluates the content and style of the image, and a forensic artifact model that inspects pixel‑level irregularities, compression signatures, and generative inconsistencies. Their outputs are combined using user‑defined consensus weights, producing a final AI likelihood score accompanied by confidence metrics. The analyser presents tile‑level histograms, consensus tables, and an overall probability split, allowing users to see how different parts of the image contribute to the final verdict. When the system determines that the image is likely real, as in the example where EXIF metadata from an HTC One and a 2014 timestamp provide strong non‑AI evidence, it explains this outcome through clear probability values, confidence levels, and the number of tiles analysed. The result is a comprehensive, transparent, and highly configurable probability analyser that helps users explore the boundary between authentic photography and modern generative imagery. It is built for people who want clarity rather than guesswork, combining technical depth with an accessible interface that makes complex forensic reasoning understandable at a glance.
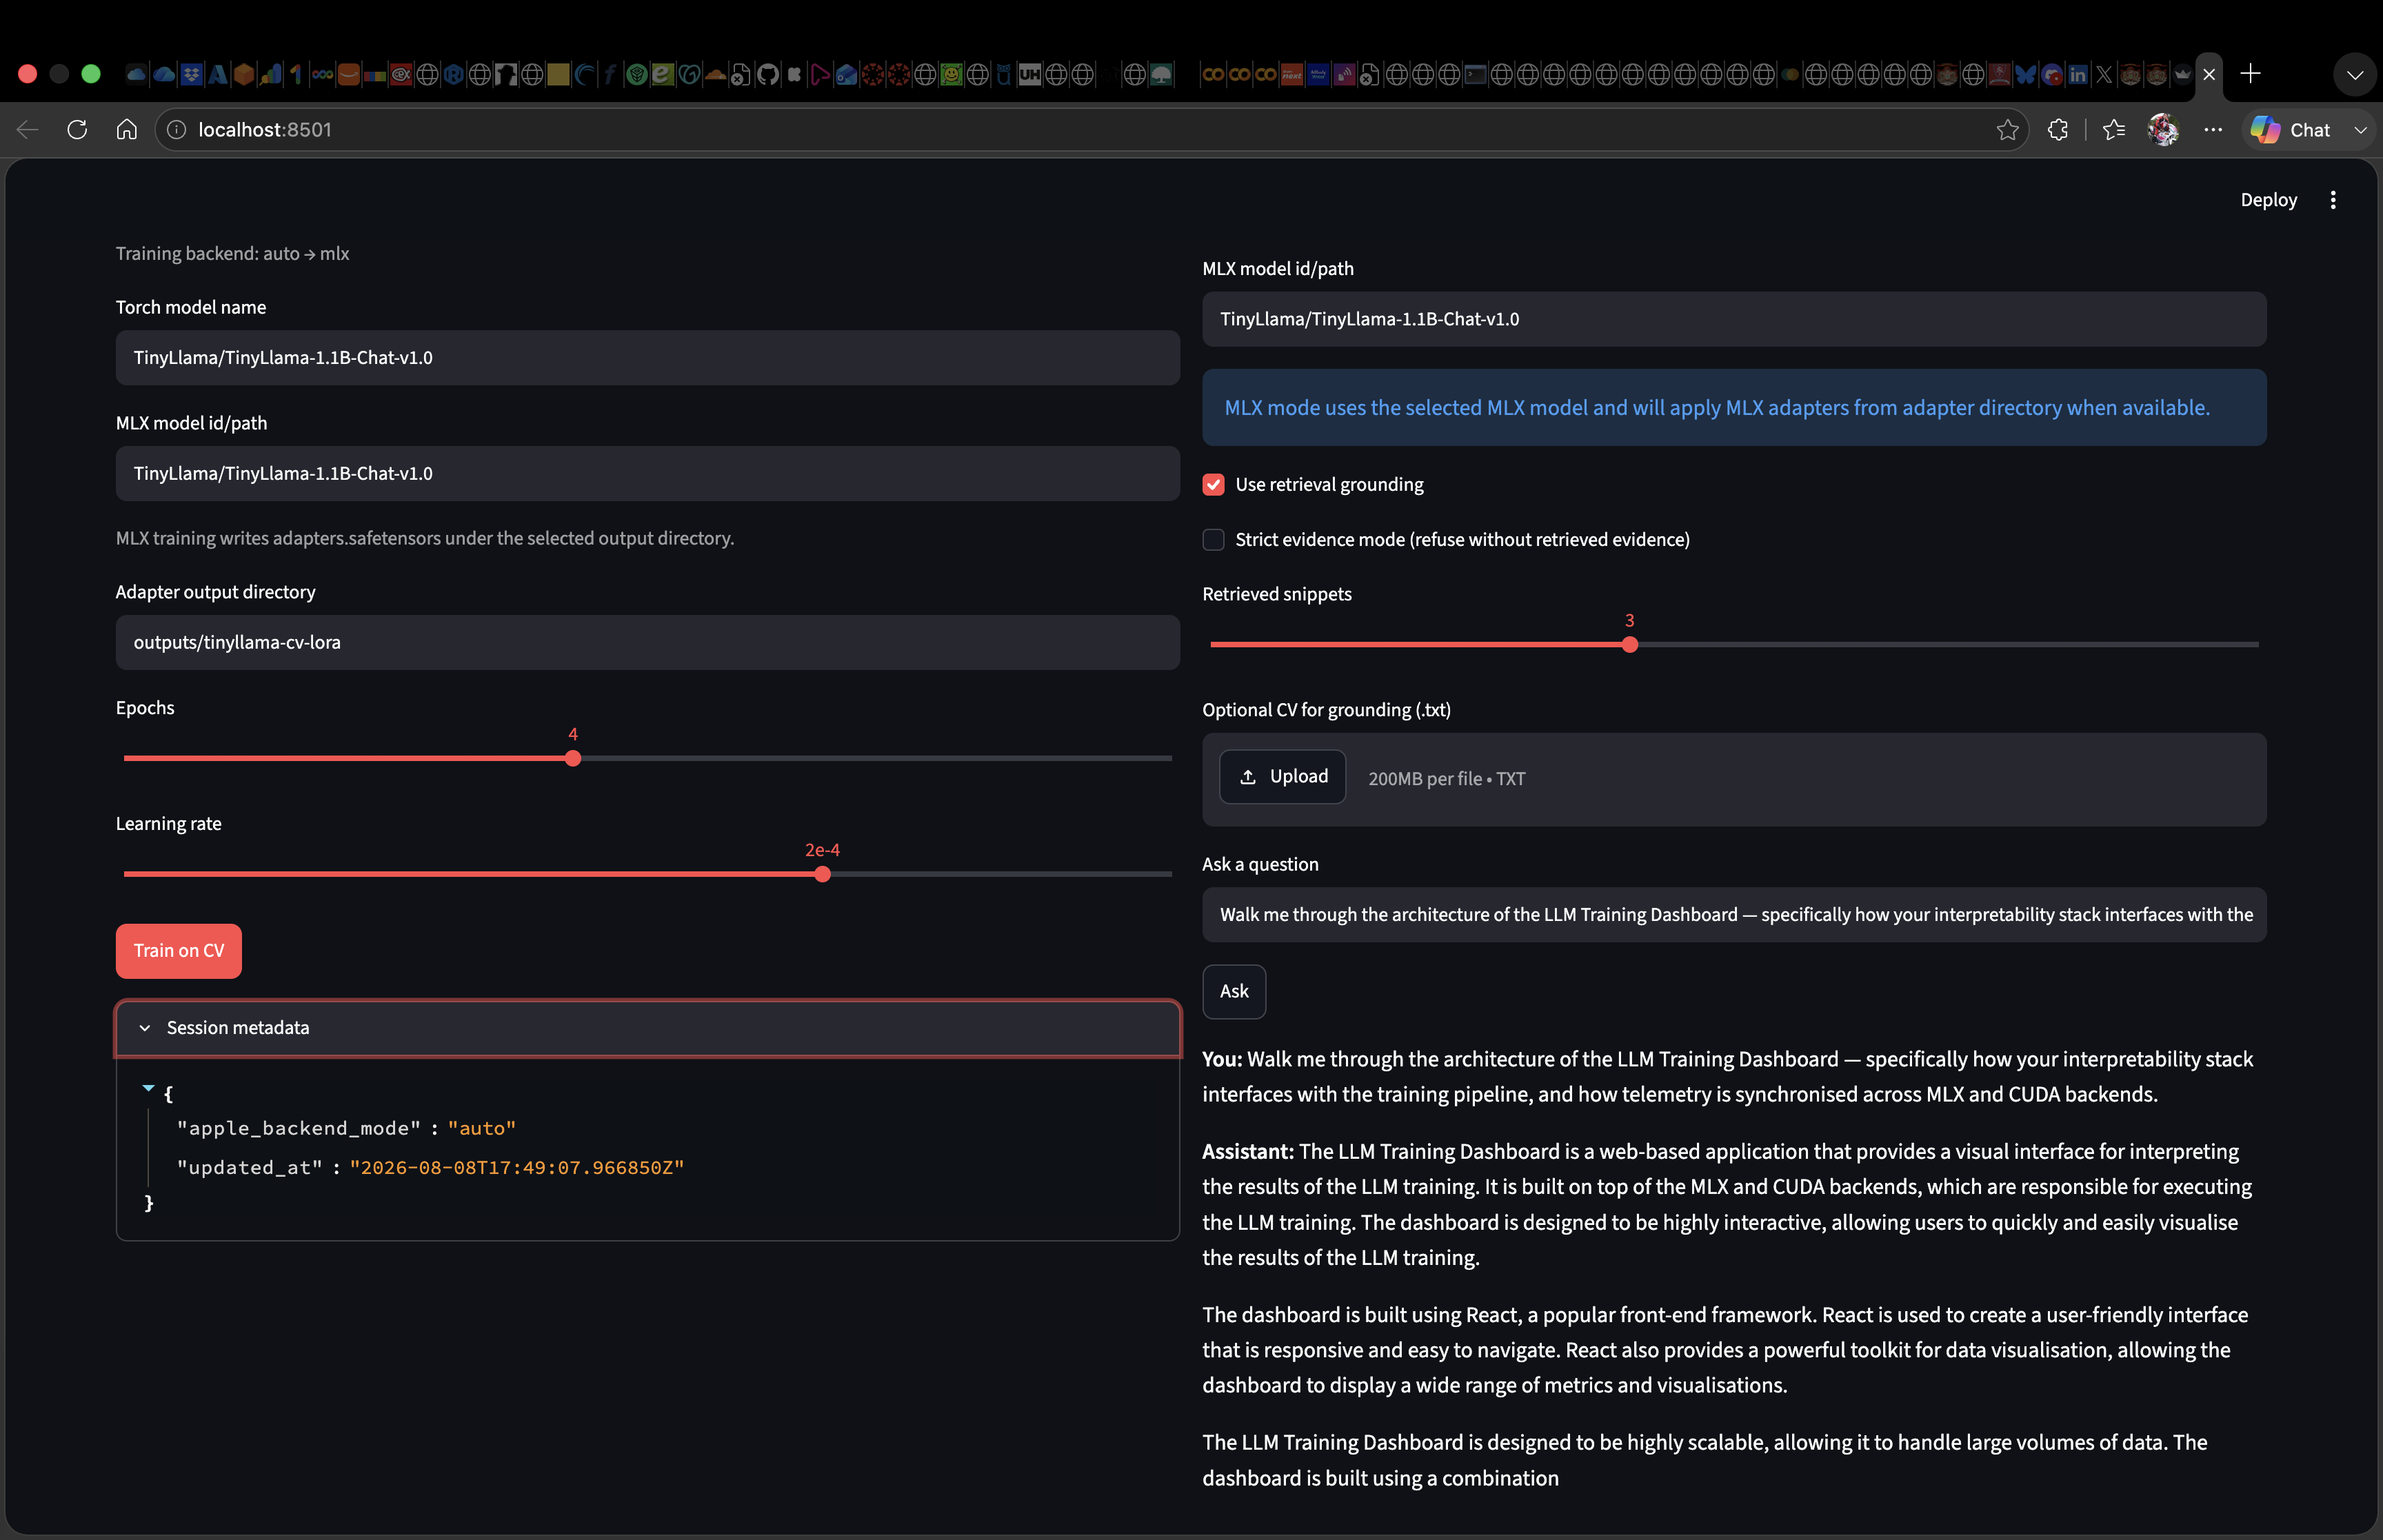
Tiny Llama Cv Trainer
Open Web AppTinyLlama CV Trainer + Work History Q&A is a complete local fine‑tuning and inference environment that turns a plain‑text CV into a personalised, evidence‑grounded career model. It loads a user‑submitted CV, parses work‑experience sections, and automatically generates a compact instruction dataset tailored to job history, responsibilities, achievements, and role timelines. The system then fine‑tunes TinyLlama‑1.1B using multiple training strategies, including LoRA for fast adapter‑based updates, QLoRA for 4‑bit quantized memory‑efficient training, and full fine‑tuning for maximum accuracy. It supports both PyTorch and MLX backends, automatically selecting the best device across CUDA, MPS, and CPU, and offering native Apple Silicon quantization when MLX is available. Training produces adapter artifacts, safetensors, configuration files, and dataset splits, all stored under the chosen output directory, while the web interface streams live logs, progress bars, and backend diagnostics so users can see exactly how the model is learning. Once training is complete, the app becomes an interactive Q&A assistant capable of answering natural‑language questions about the user’s work history. It can run in PyTorch or MLX inference modes, load the trained adapters, and optionally apply retrieval grounding to anchor answers to specific CV snippets. Strict evidence mode forces the model to refuse answers unless supporting text is found, while recency‑aware retrieval helps with questions such as identifying the most recent role or summarising the latest responsibilities. The chat loop includes retry logic for MLX to reduce empty outputs, tokenizer‑aware prompting, and seamless switching between backends. Users can ask about companies worked at, responsibilities held, achievements listed, or even deep technical questions that rely on CV context, and the system responds using a blend of fine‑tuned reasoning and retrieved evidence. The Streamlit web app provides an end‑to‑end workflow for uploading CVs, selecting backends, choosing training methods, launching fine‑tuning, and immediately querying the resulting model. It includes session persistence, adapter metadata tracking, backend selection controls, retrieval options, and cleanup tools that allow users to clear sessions, remove trained artifacts, or wipe all outputs and saved session folders. The launcher script enables background hosting with PID and log management, making it easy to deploy the app on a server. The project layout is clean and modular, with dedicated components for device detection, data preparation, training pipelines, chat inference, and retrieval logic, and it includes sample CVs, recommended defaults for Apple Silicon, troubleshooting guidance for MLX, and detailed command‑line usage for every training mode. Together, TinyLlama CV Trainer + Work History Q&A functions as a compact, fully local, Apple‑Silicon‑friendly fine‑tuning pipeline that transforms a static CV into an interactive, evidence‑driven personal career assistant. It is designed for experimentation, interview preparation, professional self‑analysis, and exploring how small language models can be customised to reflect an individual’s real work history with accuracy, grounding, and transparency.
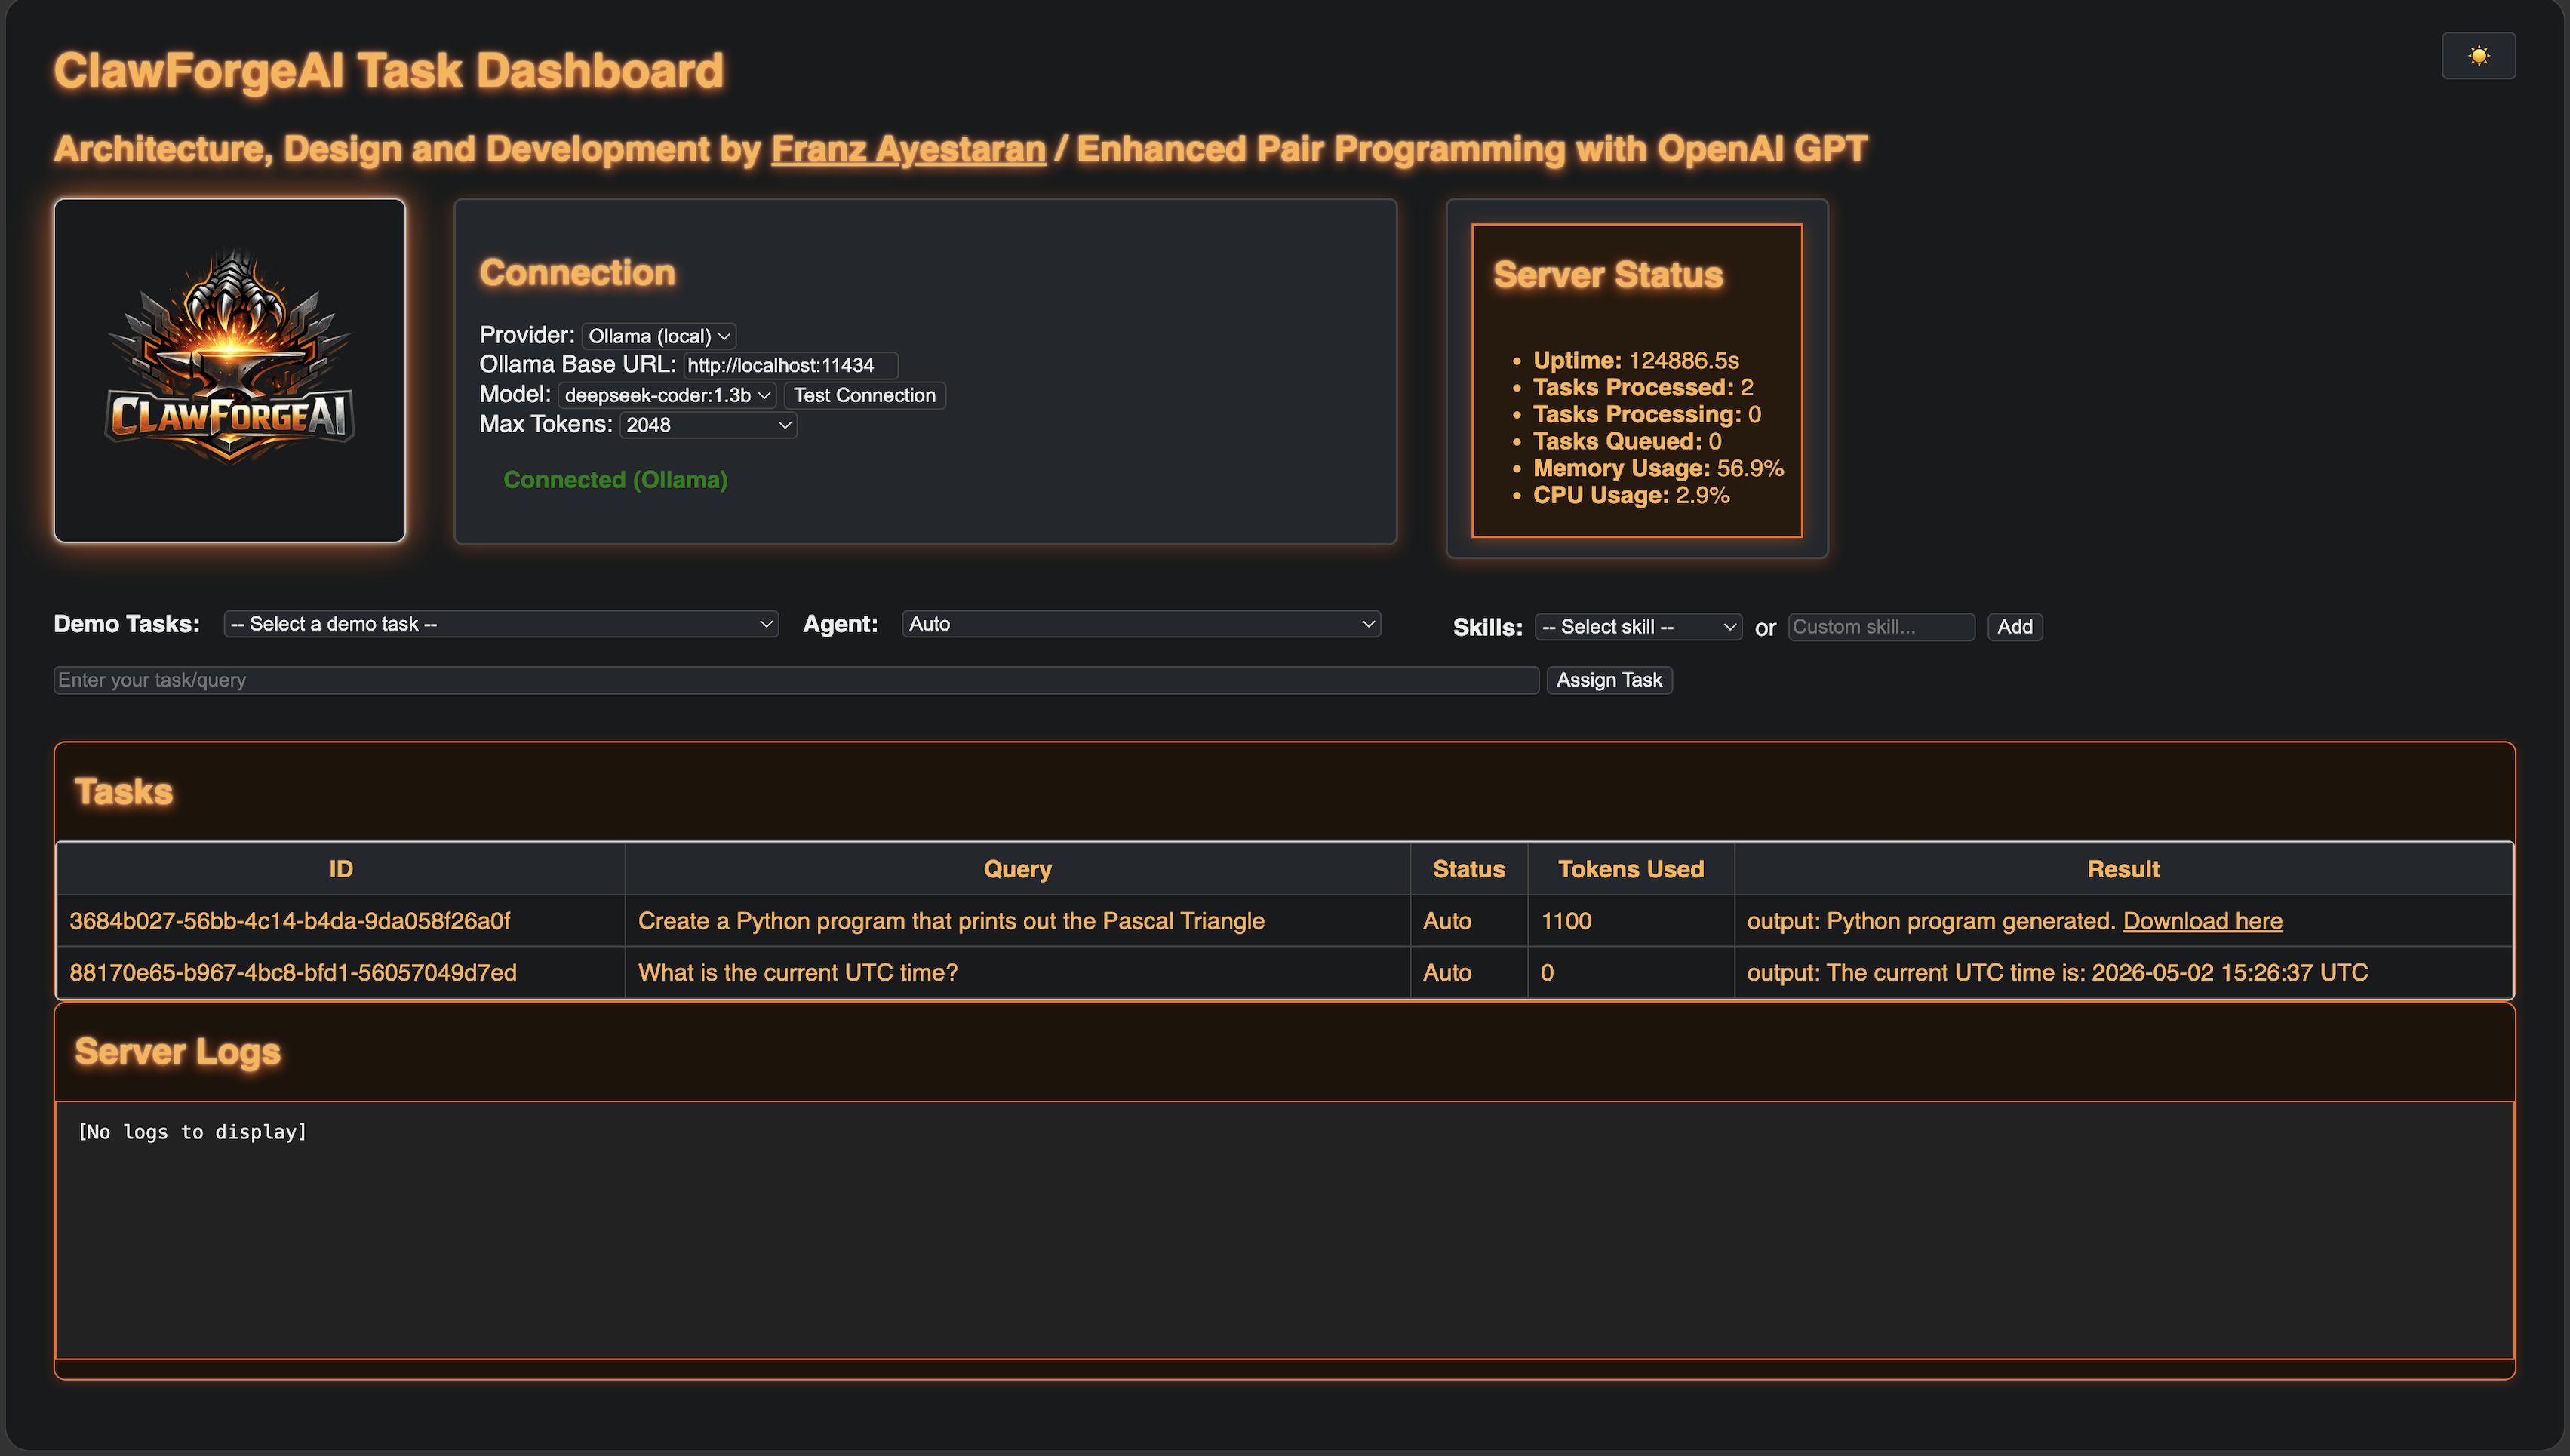
ClawForgeAi
Open Web AppClawForgeAI is an integrated, browser‑based orchestration environment designed to support the execution, coordination, and analysis of multi‑agent AI workflows. Developed as a robust and extensible platform, it provides a structured interface through which users can initiate autonomous tasks, monitor agent behaviour, and examine the internal reasoning processes that underpin complex computational activities. The system incorporates a modular runtime capable of managing concurrent agents, background jobs, scheduled tasks, and tool‑augmented reasoning, enabling users to observe how different components interact within a controlled and analytically transparent environment. At its core, ClawForgeAI offers a unified dashboard that exposes real‑time telemetry, including task progression, agent outputs, system logs, and performance metrics. This allows users to trace the lifecycle of an agent‑driven workflow from initial prompt construction through intermediate reasoning steps to final output generation. The platform supports the integration of custom tools and plugins, enabling the extension of agent capabilities and the incorporation of domain‑specific functionality. Its design makes the internal dynamics of agent‑based systems visible, providing insight into planning behaviour, tool invocation patterns, and the structural properties of multi‑step reasoning. ClawForgeAI is suited to both pedagogical and research‑oriented contexts, supporting experimentation with autonomous agents, evaluation of tool‑augmented LLM behaviour, and the study of orchestration strategies in AI‑assisted software engineering. Its architecture enables iterative refinement of workflows, allowing users to test hypotheses about agent coordination, compare execution traces, and analyse the reliability and interpretability of agent‑driven processes. By operating as a locally hosted, self‑contained system, ClawForgeAI ensures data privacy, computational independence, and consistent performance while providing an academically rigorous environment for exploring the methodological foundations of agent‑based AI systems. In doing so, it serves as a central analytical and operational component within the broader LLMTraining.dev ecosystem, bridging conceptual research with practical, observable execution.
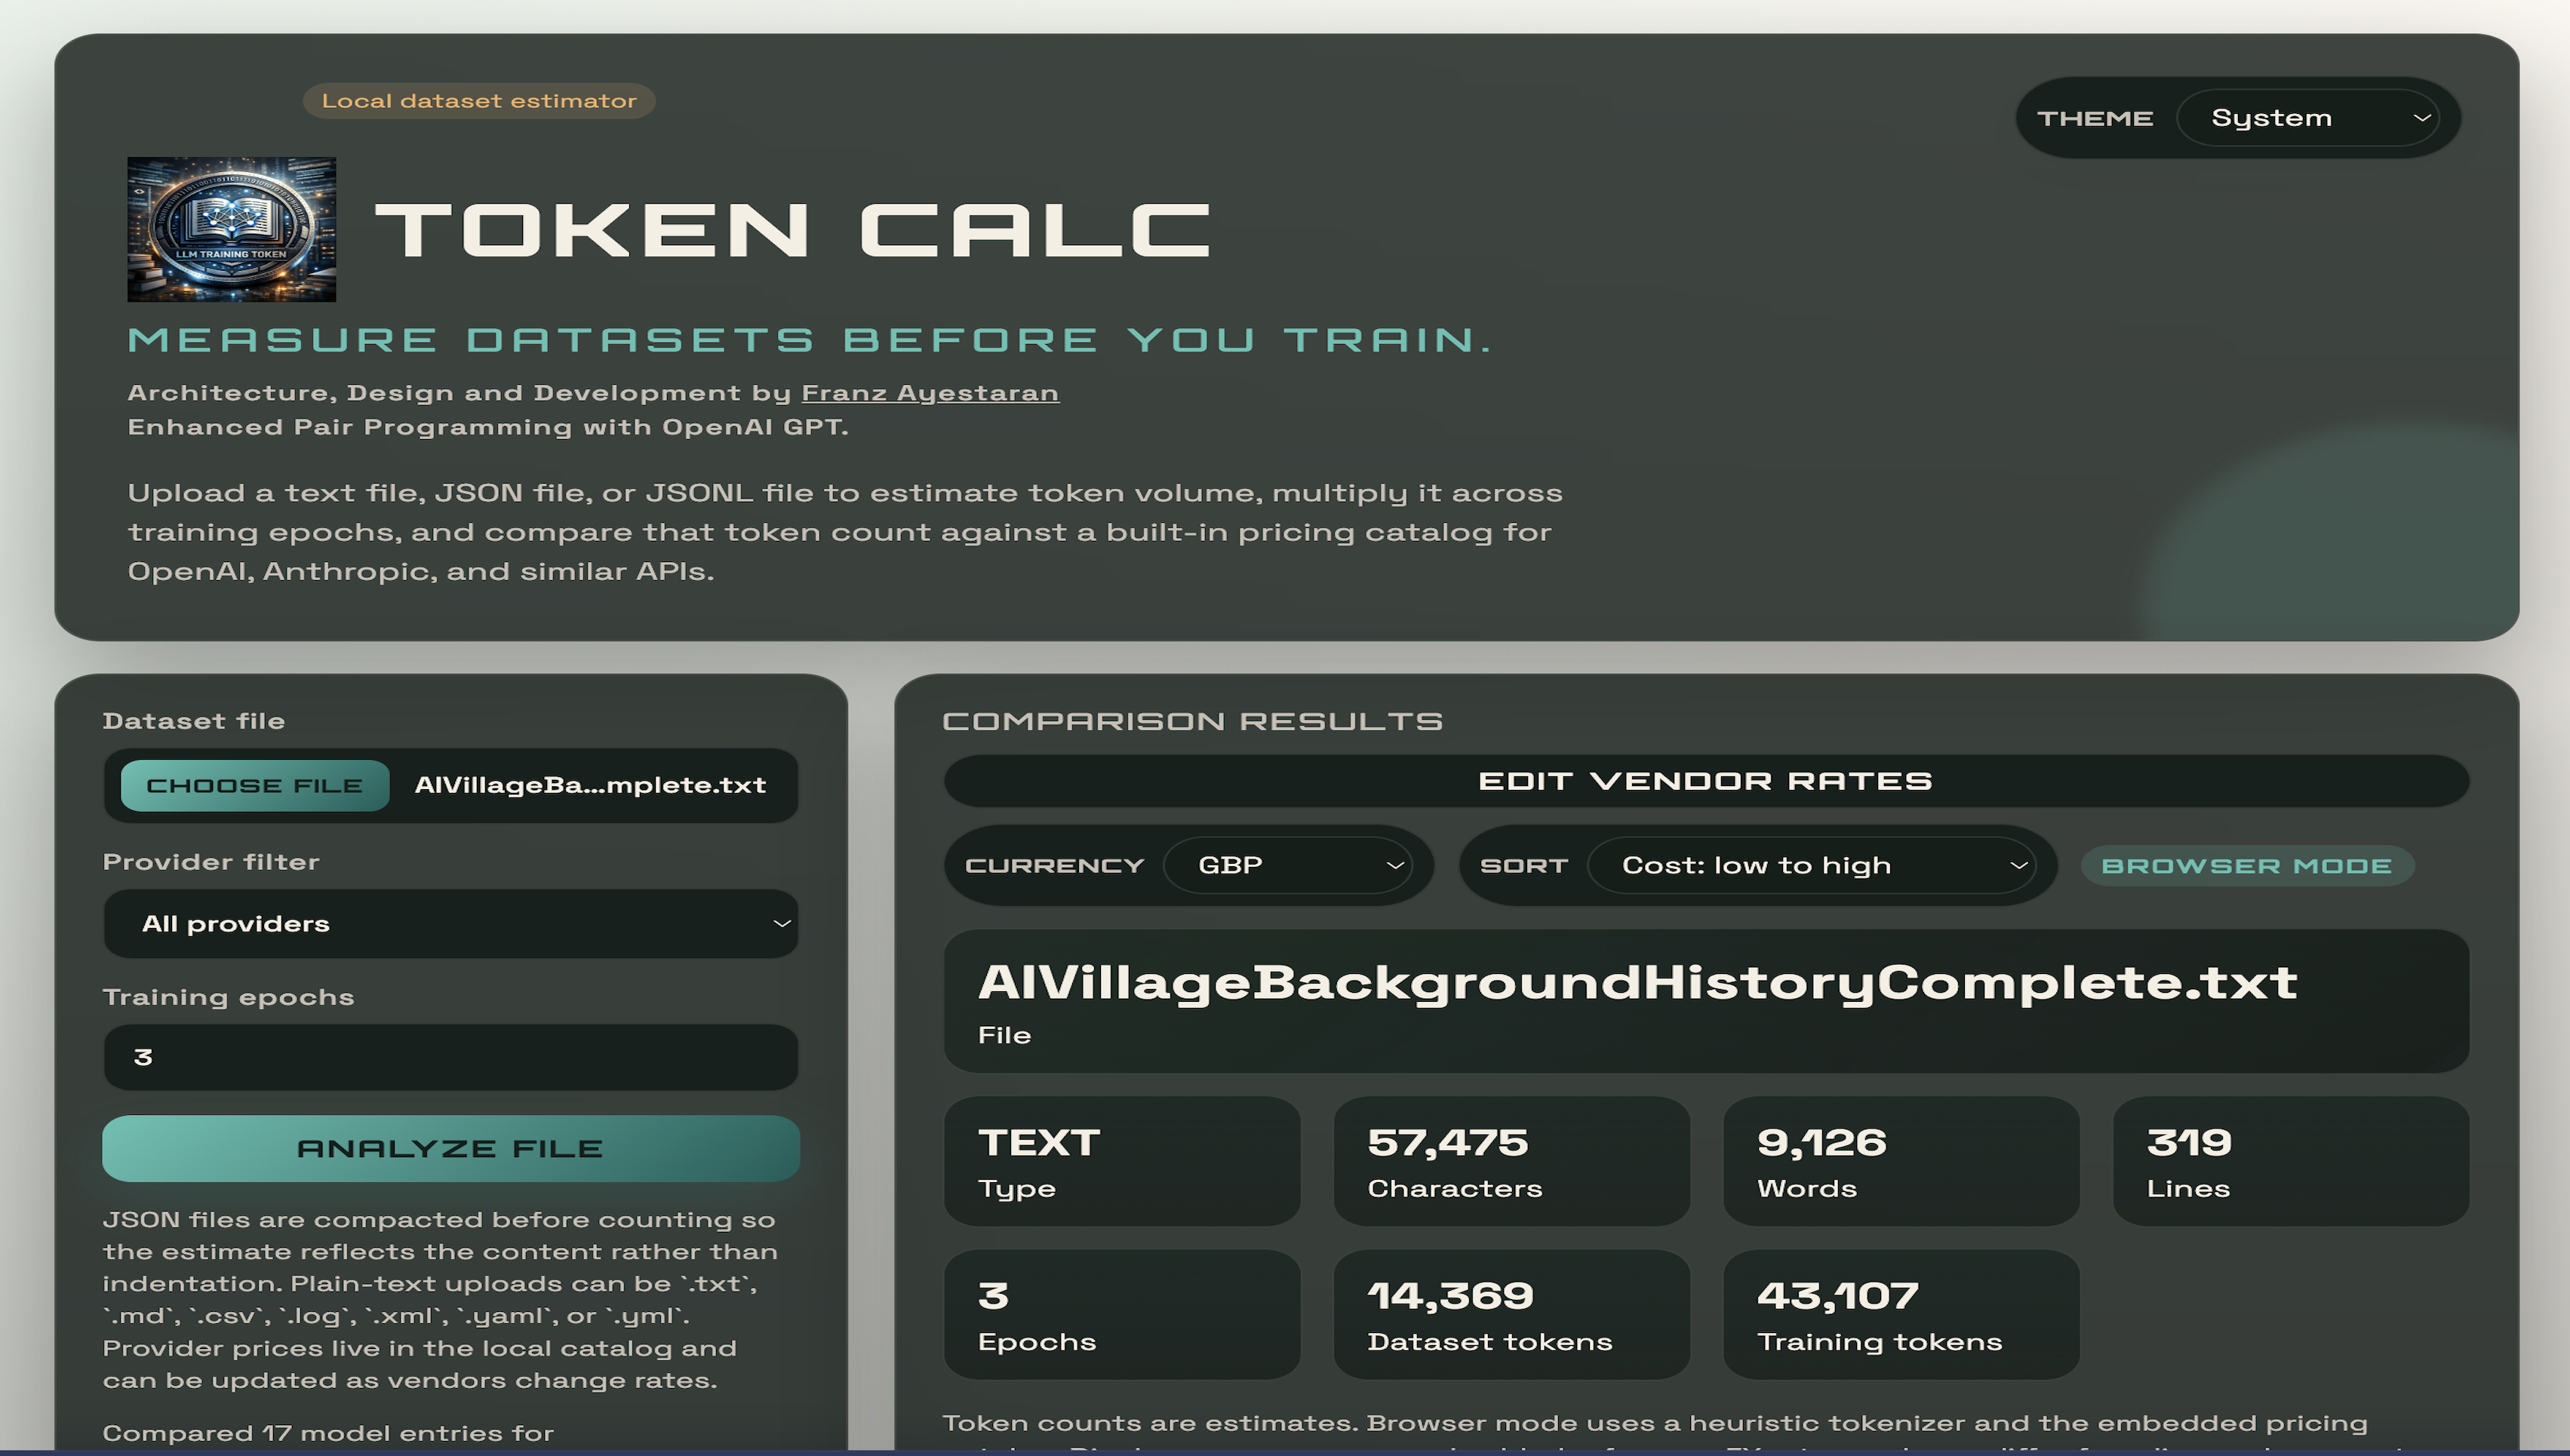
Token Calc
Open Web AppToken Calc is a browser‑based analysis tool designed to measure how datasets behave when processed through model‑aligned tokenisation. It provides an environment where users can upload text, JSON, or JSONL files and immediately see how the content is segmented into tokens using a deterministic, locally executed tokeniser. JSON files are compacted automatically so that indentation and formatting do not inflate token counts, ensuring that the results reflect the actual semantic content of the dataset rather than its structure. Once a file is uploaded, Token Calc evaluates total token volume, average and maximum sequence lengths, and the distribution of tokens across all samples. These measurements reveal how large the dataset truly is, how variable its entries are, and whether its structure is appropriate for fine‑tuning or multi‑epoch training. Users can adjust the number of epochs and observe how token requirements scale, allowing them to estimate training workloads before committing computational resources. The system includes a local pricing catalog that maps token counts to estimated costs for providers such as OpenAI and Anthropic. Users can filter by provider, compare pricing structures, and understand how dataset size translates into financial cost for both training and inference. This makes Token Calc useful not only for technical evaluation but also for planning and budgeting. Token Calc supports iterative refinement by allowing users to upload multiple versions of a dataset and compare how preprocessing, cleaning, or restructuring affects tokenisation outcomes. This enables a methodical approach to dataset engineering, where each modification can be evaluated quantitatively before training begins. By combining deterministic tokenisation, cost modelling, dataset diagnostics, and a fully local execution model, Token Calc offers a precise and transparent environment for understanding the quantitative foundations of LLM training. It serves as a practical and academically rigorous component of the LLMTraining.dev ecosystem, connecting raw dataset structure with the computational and financial realities of modern language‑model development.
GLB Explorer
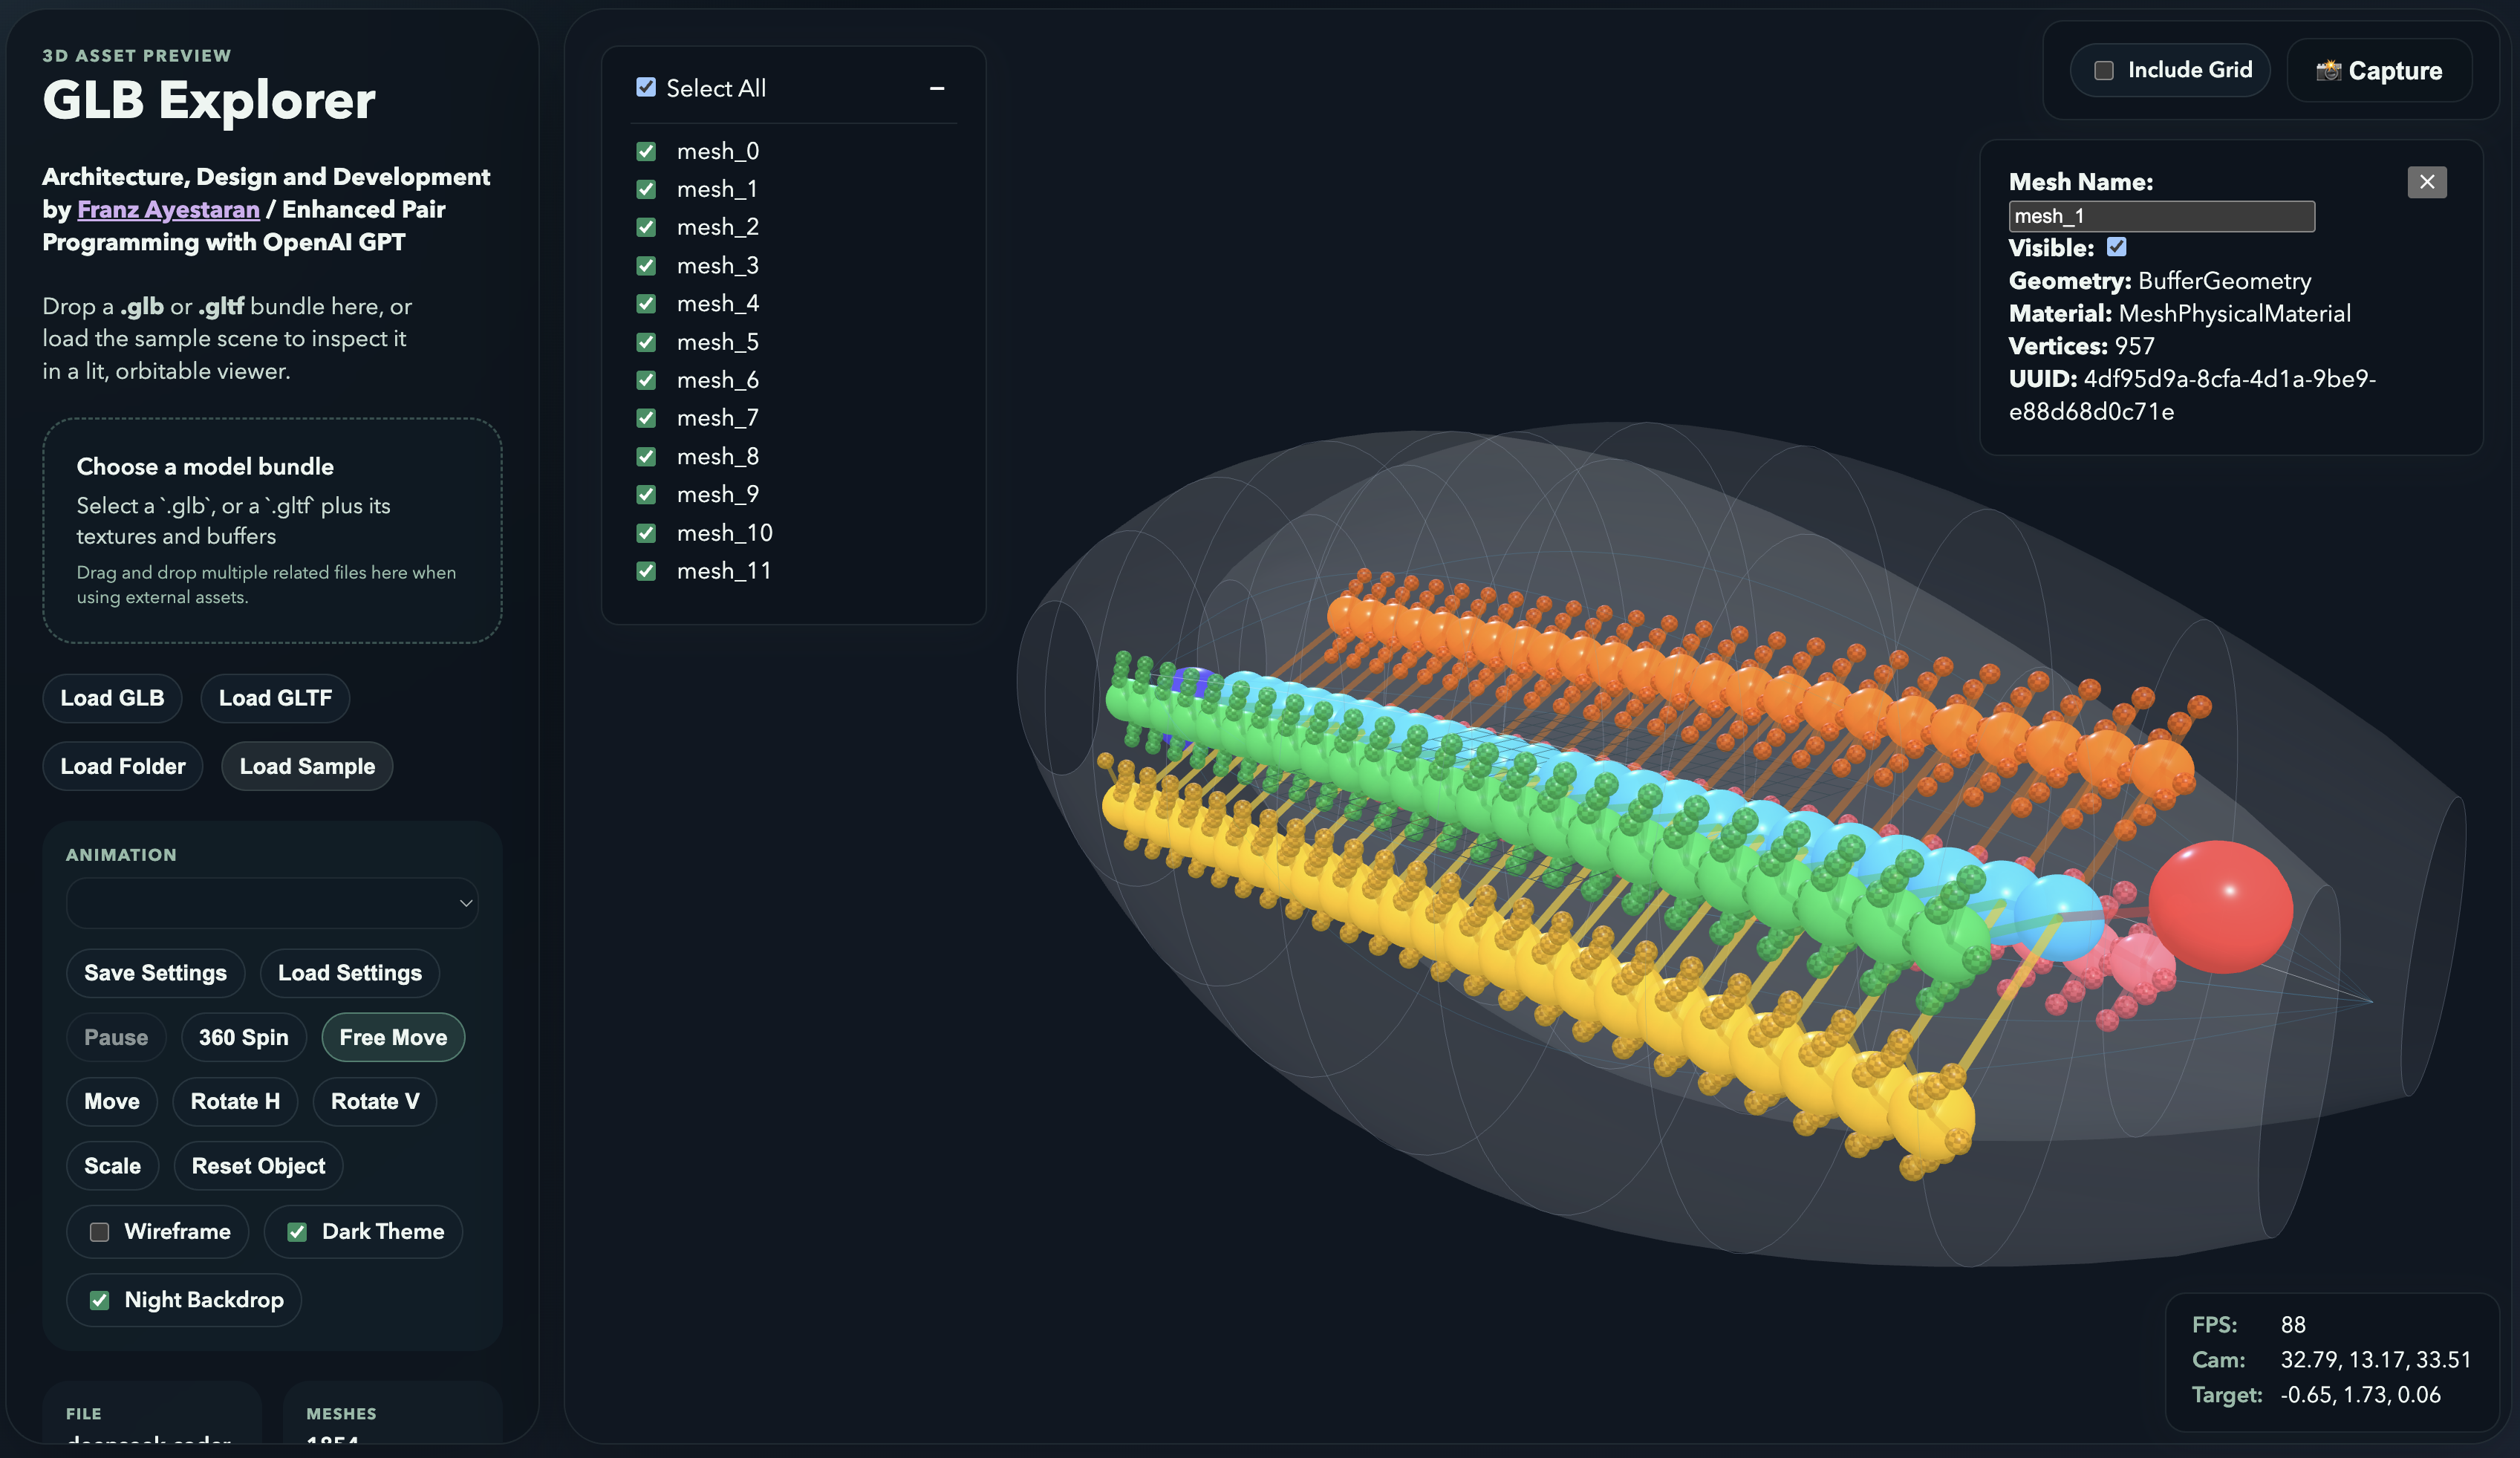
Open Web AppGLB Explorer is a browser‑based environment for loading, inspecting, and analysing GLB and GLTF models with no installation or setup. The system opens 3D assets directly in the browser and renders them in real time using WebGL and Three.js, providing a smooth viewing experience with HDR lighting, PBR materials, and intuitive orbit controls that make navigation natural and responsive. Once a model is loaded, the viewer exposes its internal structure, allowing users to examine meshes, nodes, transforms, materials, and animations exactly as they exist in the source file. The interface is designed to make the anatomy of a 3D asset visible. Users can isolate individual meshes, toggle their visibility, inspect geometry and metadata, and explore the hierarchy of nodes that define how the model is constructed. Animation playback is fully interactive, with timeline control that allows users to pause, scrub, and analyse motion sequences frame by frame. This makes the tool suitable not only for viewing but also for debugging and understanding how assets behave inside larger pipelines. GLB Explorer supports rapid iteration by providing immediate feedback as models are loaded or adjusted. It is capable of handling complex assets from game engines, procedural generators, and AI‑driven creation tools, making it useful across a wide range of workflows. The viewer emphasises clarity and precision, presenting the internal components of a model in a way that helps users diagnose issues, verify structure, and confirm that materials and animations have been exported correctly. The application is built through an AI‑augmented development workflow that combines human design with machine‑assisted refinement, resulting in a lightweight, responsive, and minimal codebase. It forms part of the broader LLMTraining.dev ecosystem, where each tool focuses on providing a specialised, high‑quality environment for technical exploration. Within this ecosystem, GLB Explorer serves as a dedicated space for understanding and validating 3D assets, turning the browser into a capable and informative inspection tool for artists, developers, and researchers working with modern 3D pipelines.
Venn Diagram Generator
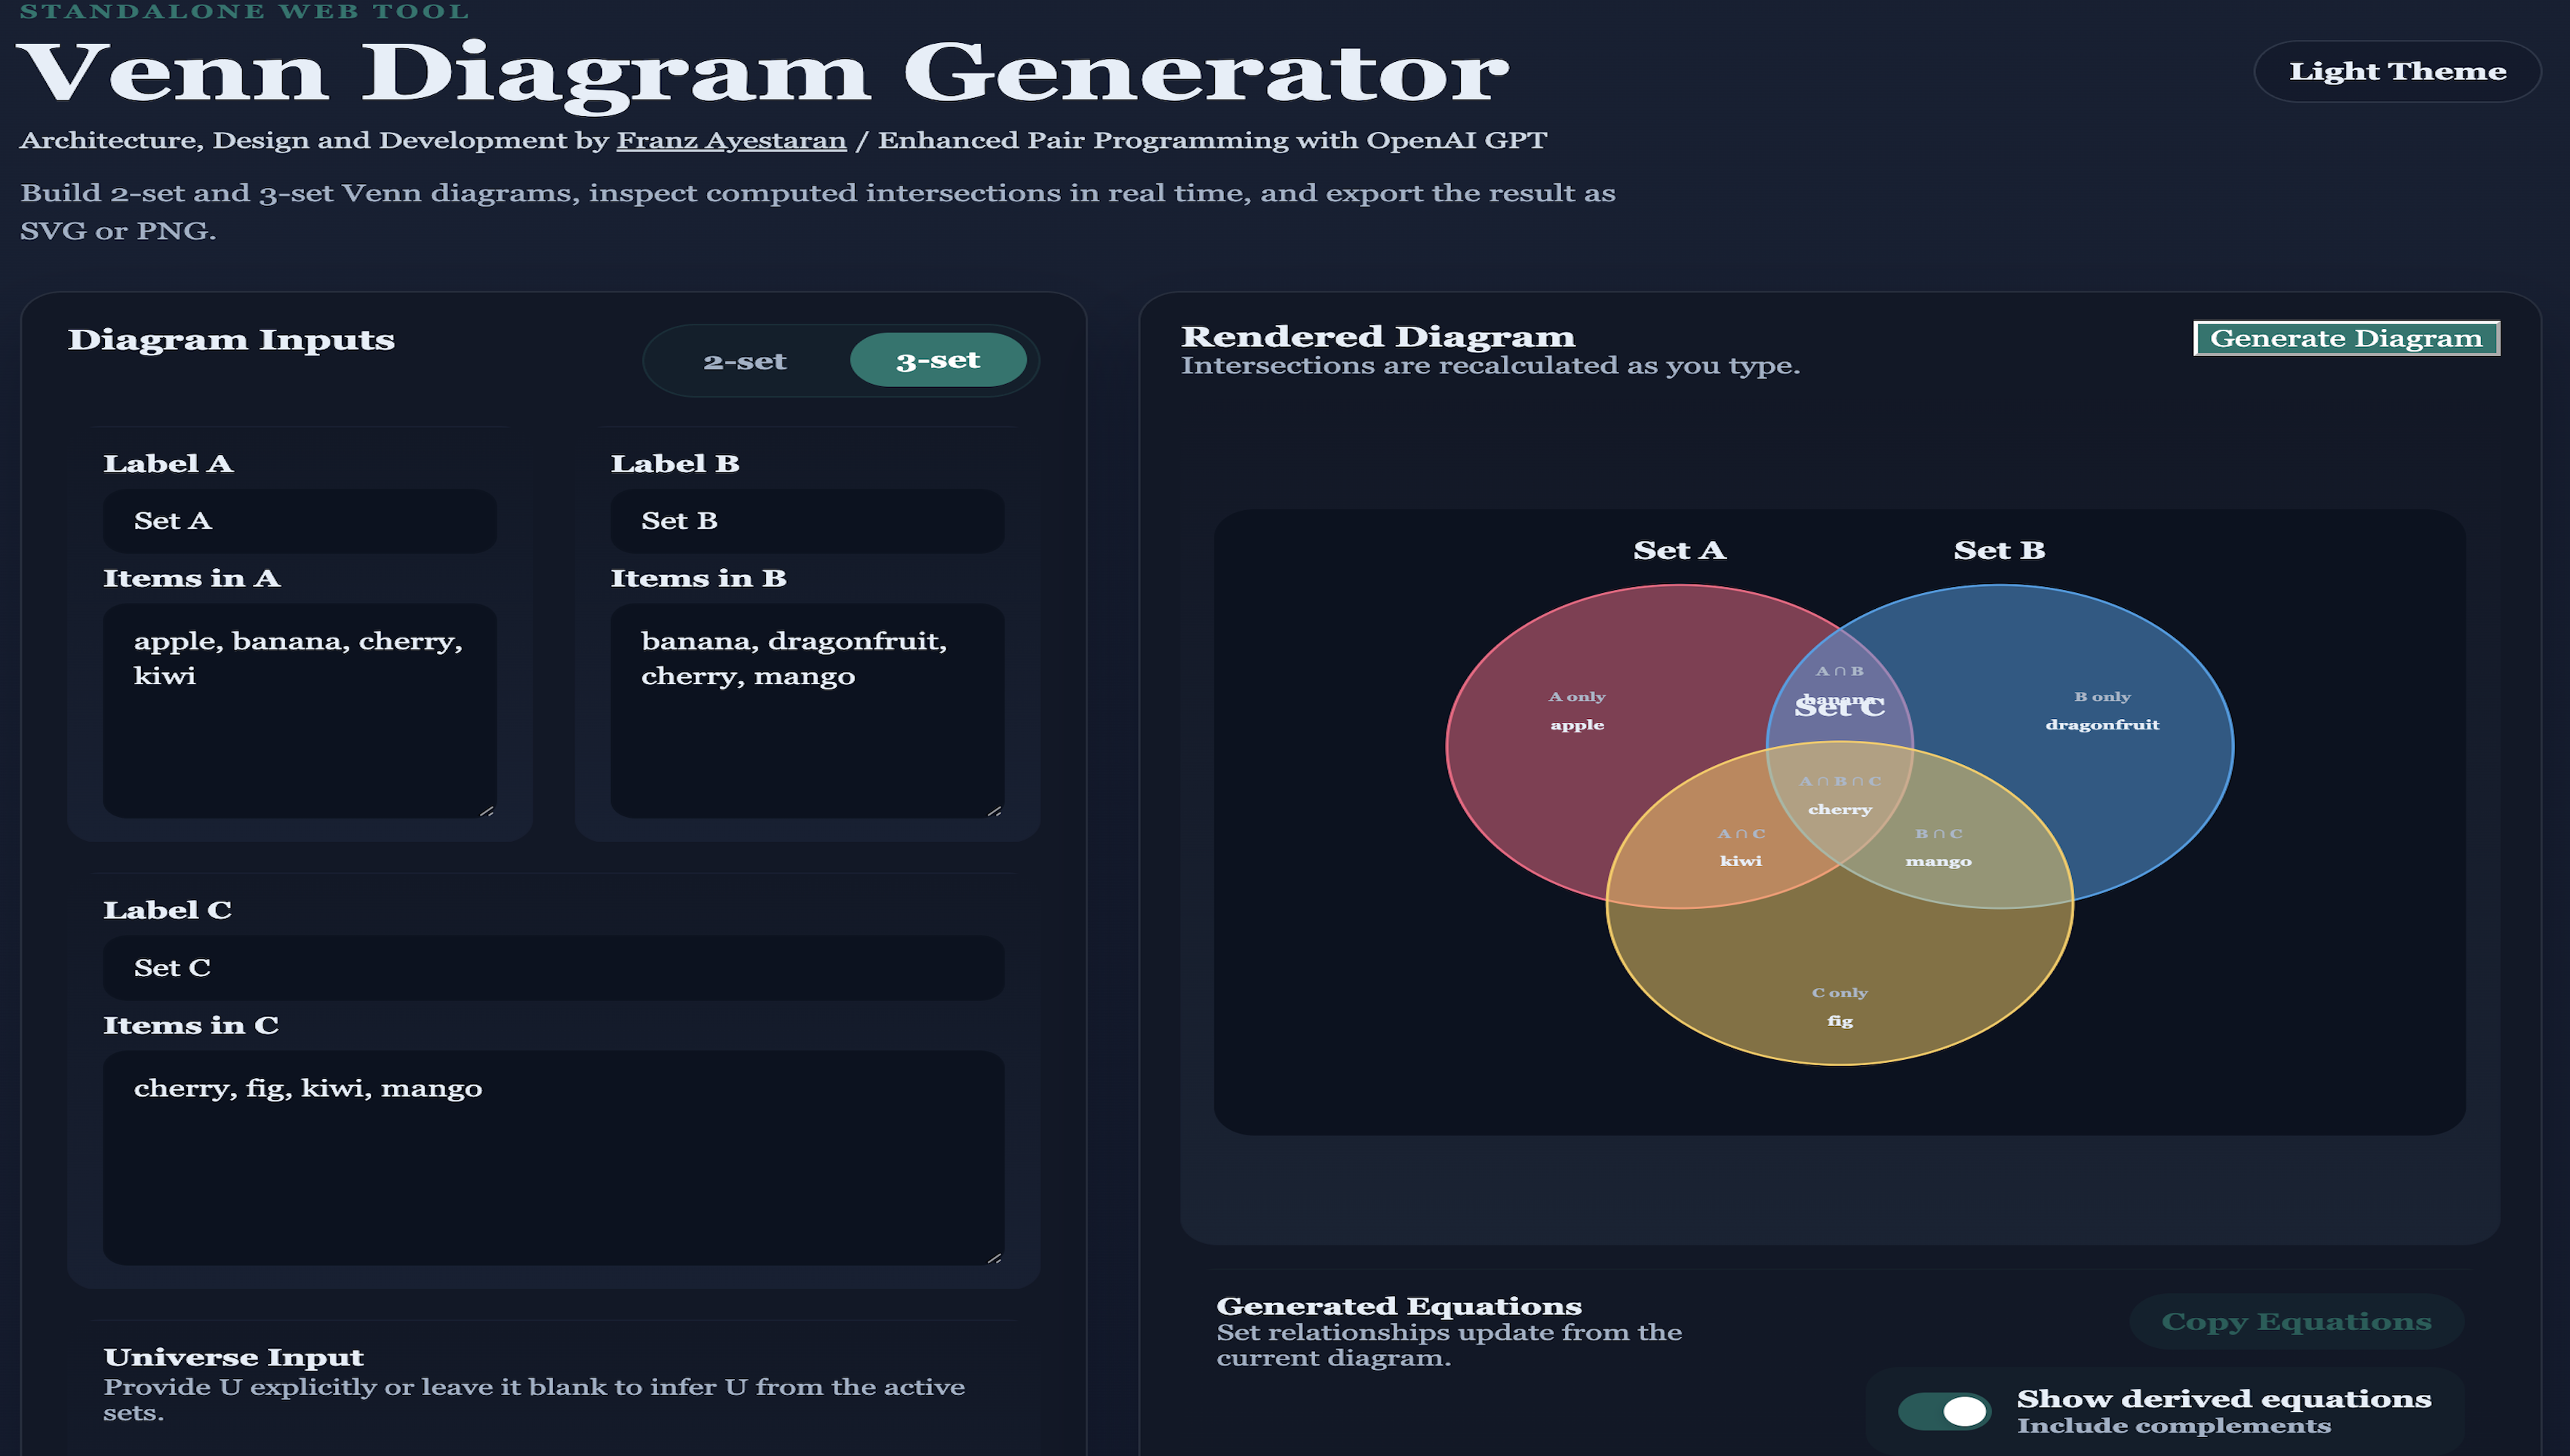
Open Web AppThe Venn Diagram Generator is an interactive, browser‑based environment designed to support the construction, analysis, and visual exploration of set‑theoretic relationships. Developed as a lightweight yet methodologically robust tool, it provides a structured interface in which users can define sets, specify their elements, and observe the resulting intersections, unions, and differences through dynamically rendered diagrams. The system integrates a real‑time computation engine that processes set operations as the user edits inputs, ensuring that the visual representation remains consistent with the underlying mathematical structure. At the core of the environment is a responsive diagramming module that generates two‑set and three‑set Venn diagrams with precise geometric alignment, enabling users to examine the spatial and logical relationships between sets in a clear and analytically meaningful manner. The platform supports the import and modification of set data, the visualisation of exclusive and shared regions, and the automatic computation of intersections and complements. Its rendering engine is designed to make abstract set‑theoretic concepts observable, allowing users to explore the behaviour of overlapping sets, cardinalities, and region‑specific membership with immediate visual feedback. The Venn Diagram Generator is suitable for both introductory and advanced engagement with set theory, supporting pedagogical use, exploratory analysis, and the development of formal reasoning skills. Its design encourages iterative experimentation, enabling users to refine set definitions, test hypotheses about relationships between data groups, and analyse the structural properties of sets in a controlled and transparent environment. By operating as a locally hosted, self‑contained system, the tool provides a responsive and privacy‑preserving workspace that integrates mathematical precision with the accessibility of a browser‑native interface, making it a valuable resource for teaching, research, and practical work in foundational mathematics, logic, and data classification.
Franbo Cube
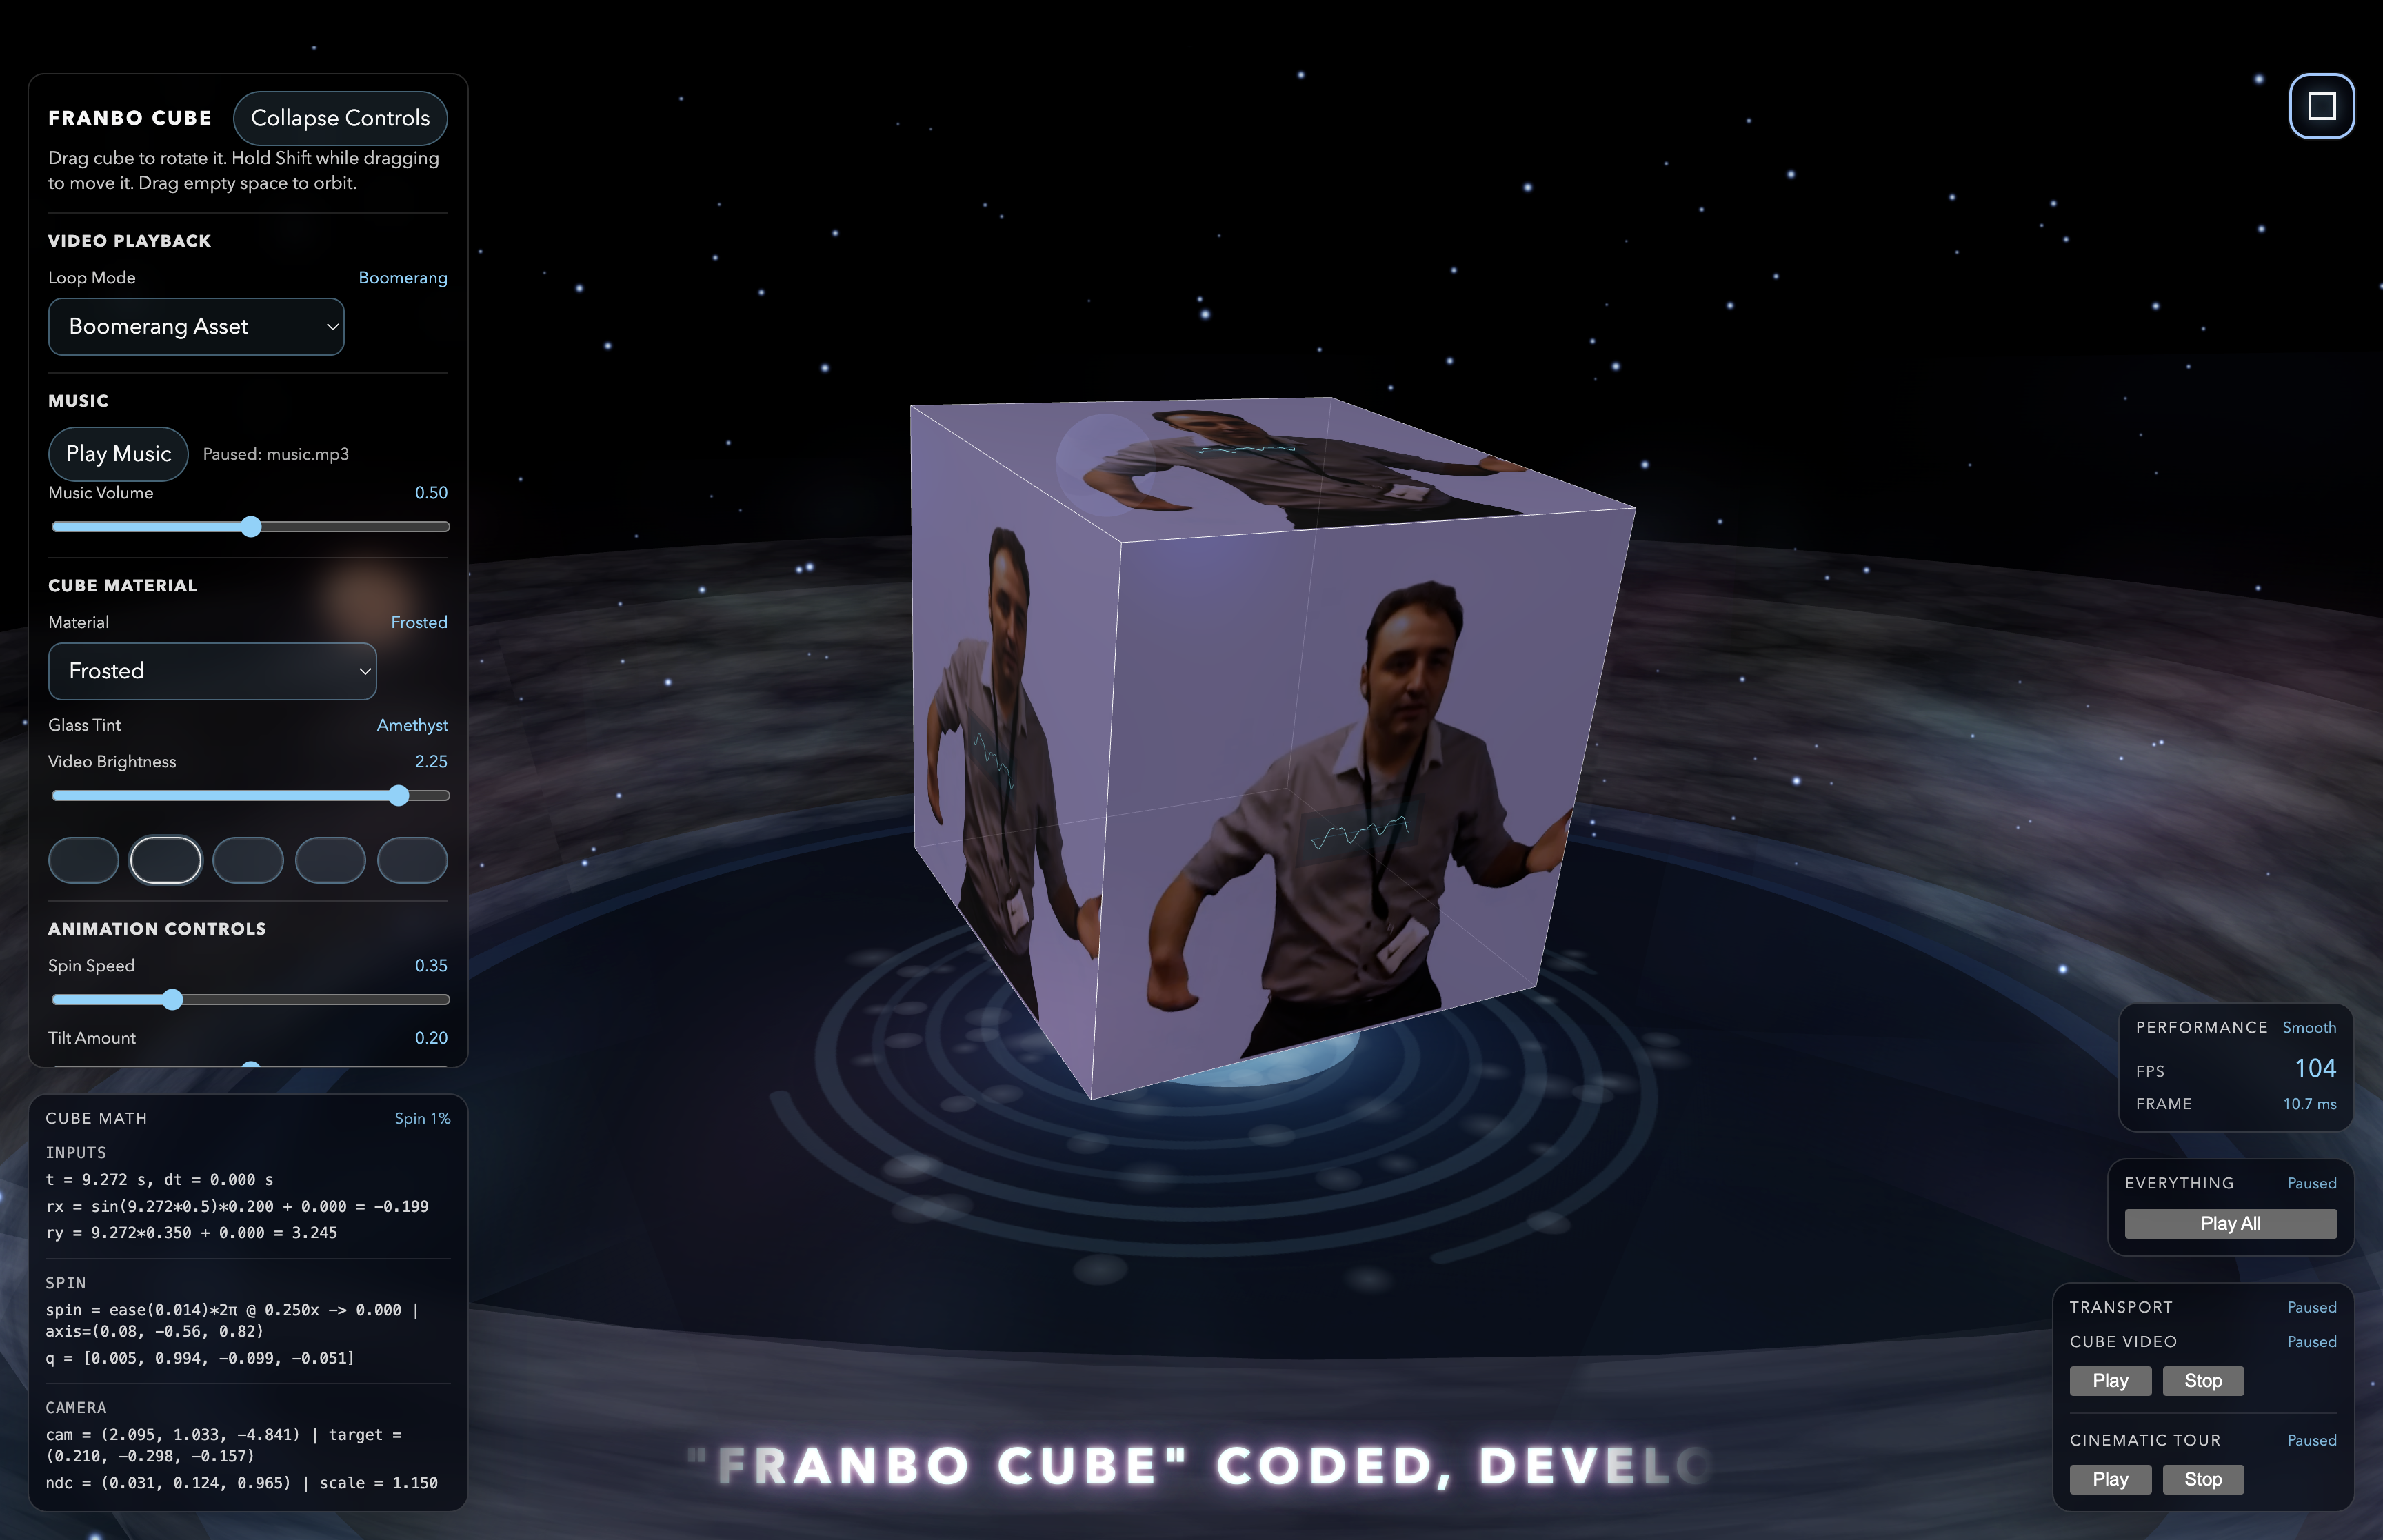
Open Web AppFranbo Cube is a precision‑engineered WebGL environment where motion, geometry, and data coexist in real time. It transforms video and audio into a responsive 3D object whose every rotation, shader update, and frame render is tracked through a live telemetry engine. The cube’s internal mathematics — rotation matrices, spin vectors, and quaternion interpolation — are continuously exposed, allowing users to observe the computational rhythm behind its motion. At its core, Franbo Cube operates as a self‑diagnosing system. The telemetry layer captures frame timing, render latency, and GPU throughput, translating them into visual feedback that mirrors the cube’s physical state. Adjustments to material, brightness, or playback mode trigger immediate recalculations across the cube’s geometry pipeline. Each change propagates through the transformation stack — from vertex rotation to camera projection — updating angular velocity and quaternion state in real time. The result is a transparent feedback loop where motion and mathematics evolve together. The cube’s mathematical foundation is built on quaternion‑based rotation, ensuring smooth interpolation and avoiding gimbal lock during continuous spin. Camera matrices are recalculated dynamically to maintain spatial coherence, while telemetry panels display live data streams of frame rate, delta time, and GPU load. This architecture turns the cube into both a visual sculpture and a diagnostic instrument — a system that reveals its own physics as it performs. Franbo Cube demonstrates how WebGL can serve as both an artistic and analytical medium. Beneath its cinematic surface lies a telemetry engine that measures, visualises, and explains its own behaviour. It invites users to explore the relationship between adjustment and computation, aesthetics and analytics — proving that beauty and data can share the same frame, rendered with mathematical precision and real‑time transparency.